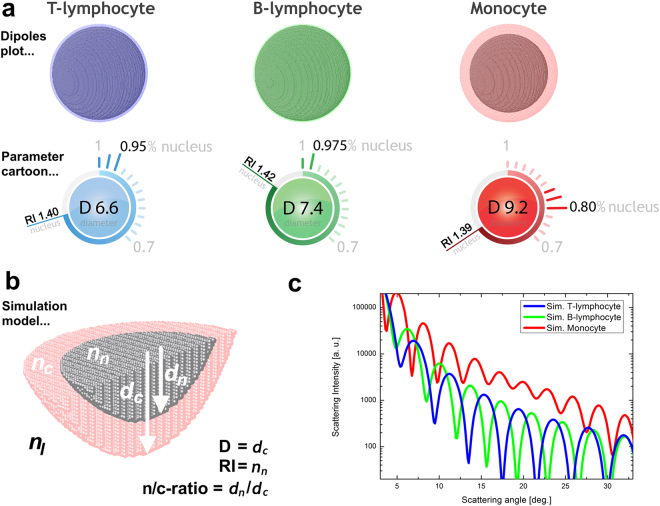
Figure 2.
Simulations of PBMC classes with multi-parameter cartoons for direct visualization of the used parameters. Simulation of (a) T-lymphocyte, with D = 6.6 µm, RI = 1.40 and n/c-ratio = 0.95; (b) B-lymphocyte, with D = 7.4 µm, RI = 1.42 and n/c-ratio = 0.975; (c) monocyte, with D = 9.2 µm, RI = 1.39 and n/c-ratio = 0.80 are shown. (d) The symmetric simulation model is illustrated; the indices n, c and l are used for nucleus, cytosol, and extracellular liquid, respectively. The nucleus is assumed to be in the center of the cell. (e) The LSP simulations for the three presented PBMC classes are plotted together to better visualize the significant LSP differences.

