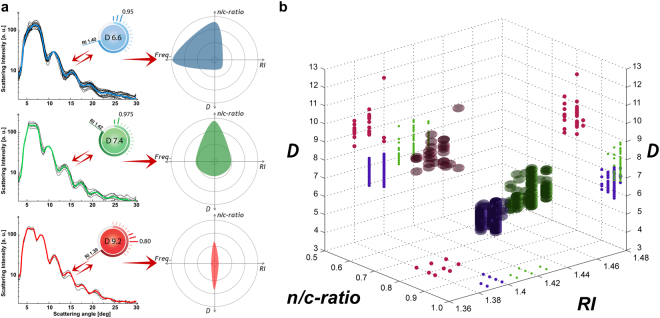
Figure 4.
Averaged LSP with best matching parameter cartoons and a multiple properties plot. (a) The obtained median biophysical properties (ID = B-E, Supplementary Table 1) are highlighted on the right side for each obtained PBMC class, using blue for T-lymphocytes, green for B-lymphocytes and red for monocytes. (b) Multiple properties plot of all measured cells -from individual separated physiological PBMC classes- are reported together (ID = D†, Supplementary Table 1). Each class is differently colored for easier readability (blue for T-lymphocytes with 409 cells, green for B-lymphocytes with 204 cells and red for monocytes with 40 cells).

