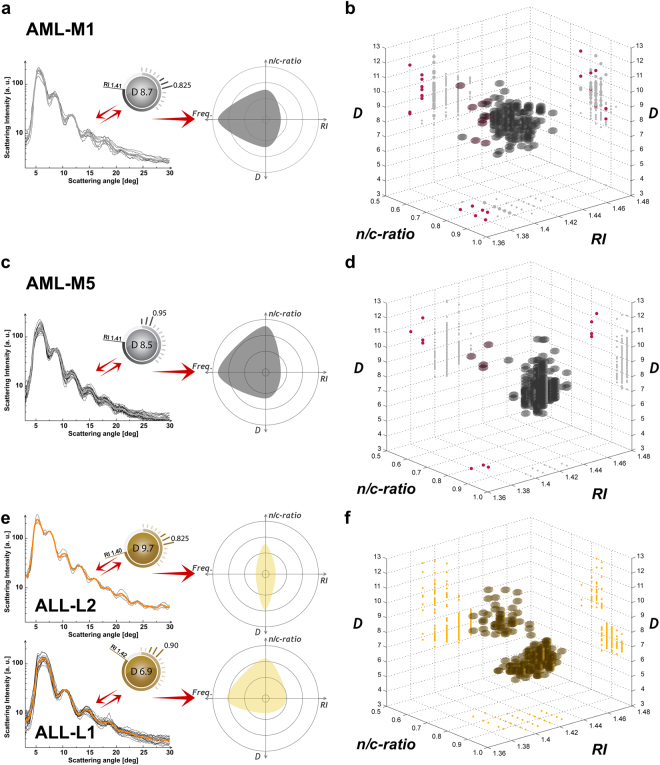
Figure 5.
Averaged LSP with matched parameter cartoon for leukemic cells and corresponding multiple properties plots. (a) Median biophysical properties of an AML-M1 blood sample are presented (ID = I, Supplementary Table 1). (b) Corresponding AML-M1 multiple properties plot. (c) Median biophysical properties of an AML-M5 blood sample are presented (ID = G, Supplementary Table 1). (d) Corresponding AML-M5 multiple properties plot. (e) Median biophysical properties of an ALL blood sample are presented (ID = H, Supplementary Table 1). (f) Multiple properties plot of an ALL (ID = H, Supplementary Table 1) blood sample is shown. Each detected cell class is differently colored for easier readability (grey for pathological monocytes with 595 cells, gold for pathological lymphocytes with 167 L1 and 48 L2 cells, red for physiological monocytes).

