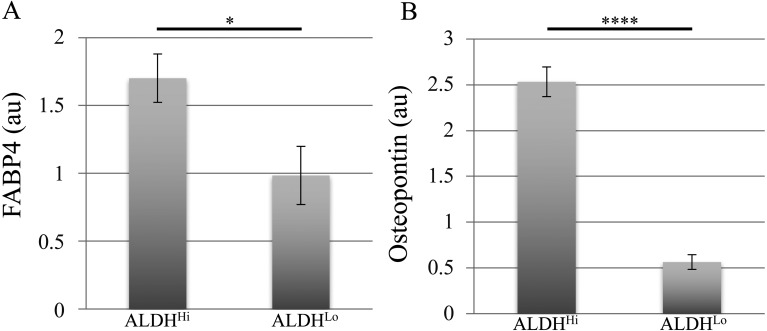
Fig. 3.
Quantitative analysis of differentiation marker-positive areas in differentiated ADSCs. (A, B) FABP4-positive (A) and osteopontin-positive (B) area ratios relative to respective areas of nuclear staining for ALDHHi and ALDHLo subpopulations of ADSCs after adipogenic (A) and osteogenic (B) induction. Values are expressed as mean ± standard error (n=5). *P<0.05, ****P<0.0001; au, arbitrary unit.

