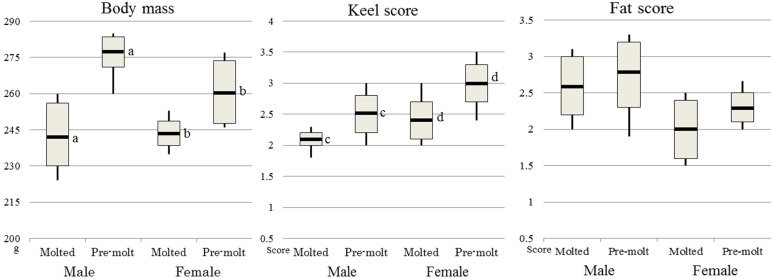
Fig. 2.
Results obtained for body mass, keel score and fat score with respect to molting during the “Flying away” period from December 2014 to December 2016. Analysis of body mass with respect to sex and molting status for 12 molted males, 10 pre-molt male, 8 molted females and 15 pre-molt females. The bar in the boxplots shows the average value, vertical lines were max and minimum value, and top and bottom end of box were average value ± SD. The same letter after measurements indicates a significant difference (P<0.05). Body mass was significantly decreased in each sex by molt, and keel score was too (P<0.05), whereas fat score was not decreased by molt (P>0.05).

