. 2017 Jul 26;8(9):6583–6593. doi: 10.1039/c7sc02545a

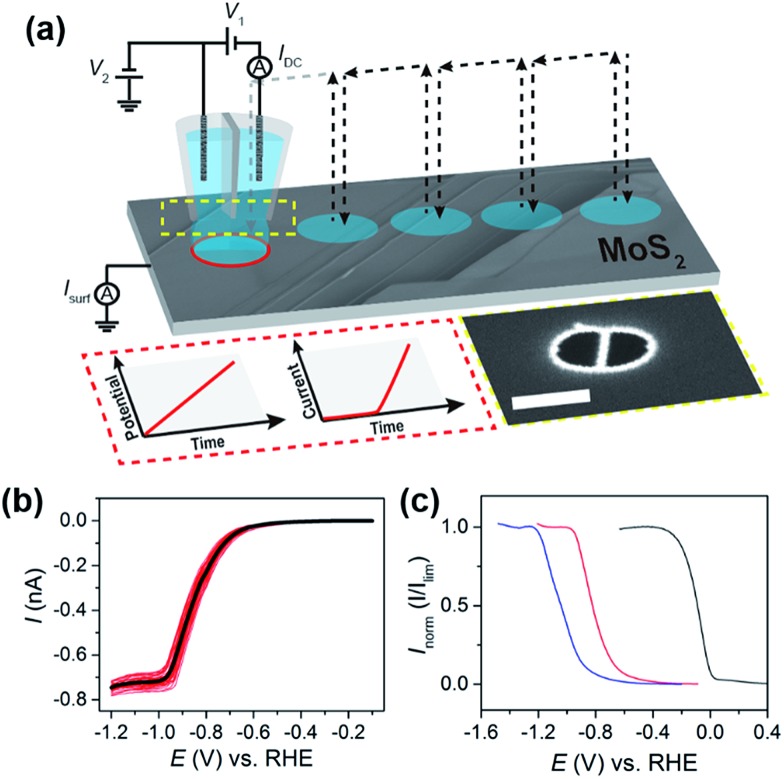
Fig. 1. (a) Schematic showing the nanoscopic electrocatalytic measurements made using voltammetric hopping mode SECCM. For SECCM, a bias voltage of V 1 was applied between the two Ag/AgCl wire QRCEs and the resulting ion conductance current (I dc) was measured and employed for probe positioning. A substrate voltage of V 2 was applied to one of the QRCEs to control the working electrode (e.g., MoS2) potential (E s), where E s = –(V 1/2 + V 2), and the working electrode current (I surf) was measured (Et and It wave-forms shown inset). The arrows show the movement of the nanopipet probe along the surface. Also shown in the inset is an SEM image of the end of a representative nanopipet probe (the scale bar indicates 400 nm). (b) Individual (red) and averaged (black) LSVs obtained from 38 different points on the basal plane of bulk MoS2 using the experimental setup outlined in (a). (c) Normalized LSVs obtained on (from left to right) bulk GC (blue trace), MoS2 basal plane (red trace), and Pt (black trace). All LSVs were obtained using the following experimental parameters: [HClO4] = 5 mM, ν = 0.5 V s–1, E b = +0.2 V, r a = 275 nm and r b = 125 nm.

Fig. 1