. 2017 Jul 26;8(9):6583–6593. doi: 10.1039/c7sc02545a

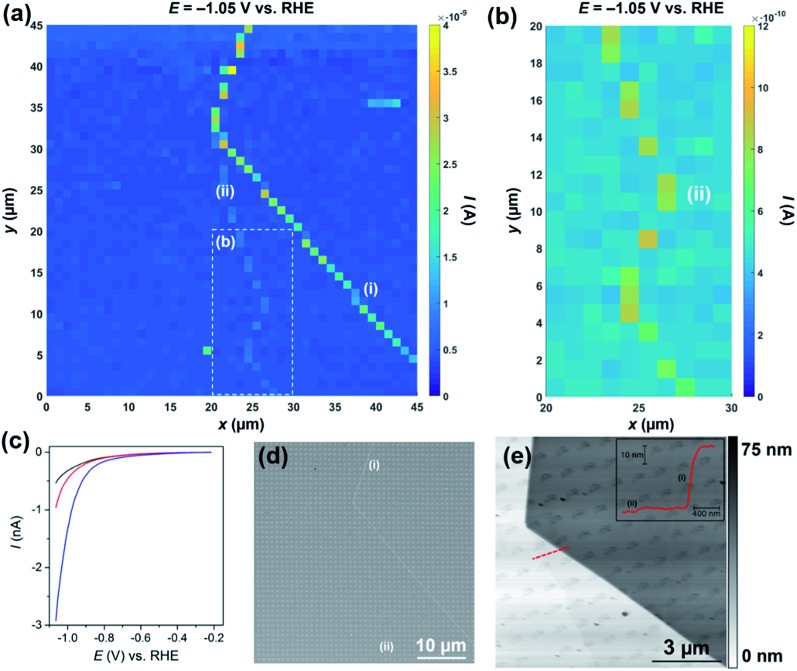
Fig. 3. (a) 45 × 45 μm and (b) 10 × 20 μm [area indicated by the dashed white box in (a)] spatially resolved current maps (equipotential images) obtained at –1.05 V vs. RHE (see Movies S2 and S3 for full potential range). (c) Representative LSVs obtained from areas containing only basal plane (black trace, average of 1500 measurements), basal plane plus defect (i) (blue trace, average of 33 measurements) and basal plus defect (ii) (red trace, average of 14 measurements) of bulk MoS2. The following parameters were used in (a–c): [HClO4] = 100 mM, ν = 0.25 V s–1, E b = +0.05 V, r a = 220 nm and r b = 110 nm. (d) SEM and (e) AFM topographical images of the scan area. Inset in (e) is an AFM line profile of the area indicated by the dashed red line. Major and minor surface defects are labelled as (i) and (ii), respectively.

Fig. 3