
Figure 2. Integrin β3 Expression on Th17 Cells in EAE.
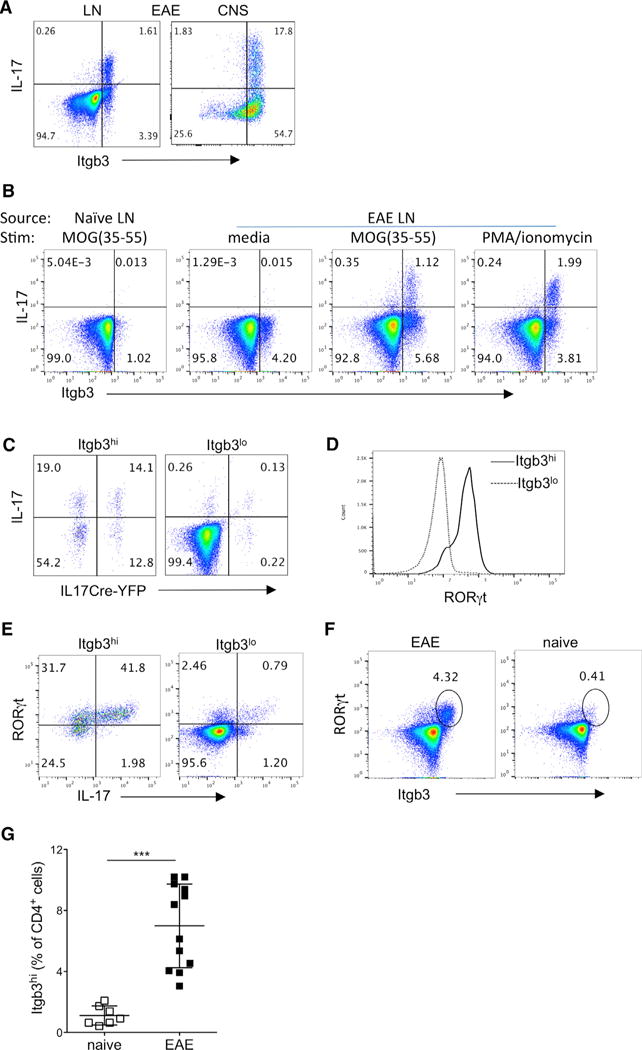
CD4+ T cells from dLNs and CNS were analyzed by flow cytometry during active EAE (day 12–16) induced in IL-17Cre-YFP fate-tracking mice.
(A) Representative flow cytometry plots of integrin β3 and intracellular IL-17 staining following PMA/ionomycin stimulation in live CD4+ cells from indicated sites.
(B) IL-17 and integrin β3 co-expression in live CD4+ T cells from naive and EAE LNs, stimulated as indicated (all EAE plots are from same donor for comparison).
(C) EAE LN cells were stimulated with PMA/ionomycin, and live CD4+ cells were then gated according to high or low integrin β3 expression to determine expression of intracellular IL-17 protein and IL17Cre-mediated YFP.
(D) Histogram comparing RORγt expression in integrin β3hi and integrin β3lo CD4+ EAE LN cells.
(E) EAE LN cells stimulated with PMA/ionomycin and analyzed for expression of IL-17 and RORγt in integrin β3hi and integrin β3lo CD4+ cells.
(F) Representative plots of RORγt+integrin β3hi population within live CD4+ cells from EAE LNs and naive LNs.
(G) Percentage of integrin β3hi cells gated from live CD4+ cells, with data pooled from three separate experiments.
Data are representative of at least three separate experiments, with two to four mice per group. Statistical significance was analyzed by one-way ANOVA. Error bars indicate mean ± SD.