
Figure 3. Integrin β3 and Th1 Cells in EAE.
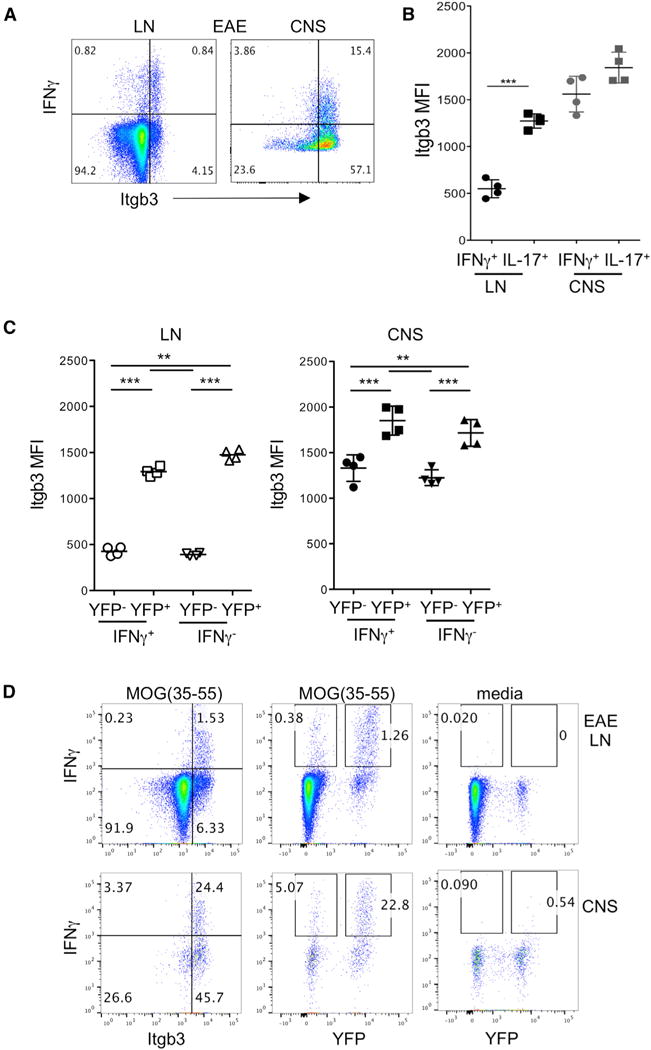
CD4+ T cells from dLNs and CNS were analyzed by flow cytometry during active EAE (day 12–16) induced in IL-17Cre-YFP fate-tracking mice.
(A) Representative flow cytometry plots of integrin β3 and intracellular IFN-γ staining following PMA/ionomycin stimulation in live CD4+ cells from indicated sites.
(B) Geometric mean fluorescence intensity (MFI) of integrin β3 expression on cells positive by intracellular cytokine staining for IFN-γ and IL-17 at indicated sites.
(C) Geometric MFI of integrin β3 expression on LNs and CNS CD4+ T cells gated according to co-expression of IFN-γ and YFP as indicated.
(D) IFN-γ and integrin β3 co-expression by live CD4+ T cells from EAE LNs and CNS, stimulated with MOG(35–55) overnight, or with no stimulation in media-only control.
Data are representative of at least three experiments with three to five mice per group. Statistical significance was analyzed by one-way ANOVA. Error bars indicate mean ± SD. See also Figure S3.