Figure 2.

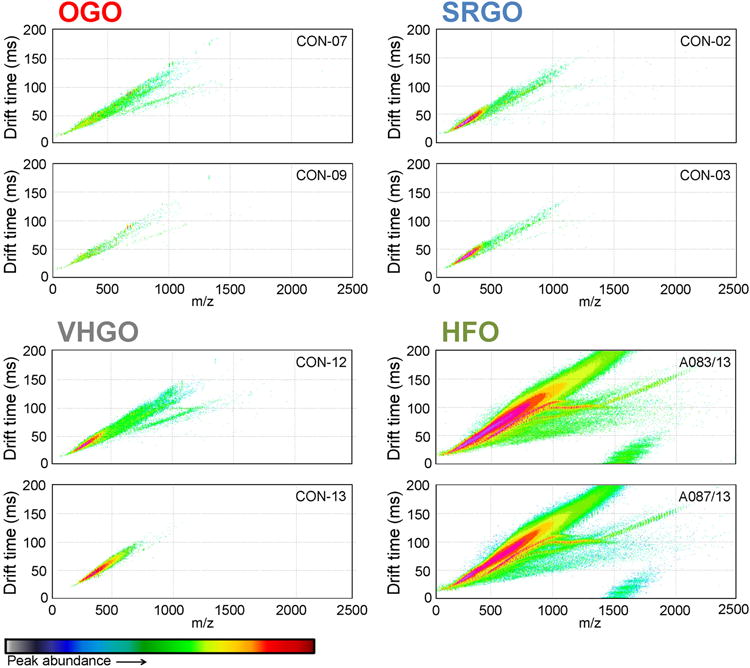
IM-MS spectra for representative petroleum substances. The figure depicts IM-MS spectra (m/z vs drift time, feature abundance is highlighted by color intensity) for each two representative of OGO, SRGO, VHGO, and HFO.

IM-MS spectra for representative petroleum substances. The figure depicts IM-MS spectra (m/z vs drift time, feature abundance is highlighted by color intensity) for each two representative of OGO, SRGO, VHGO, and HFO.