
Figure 3.
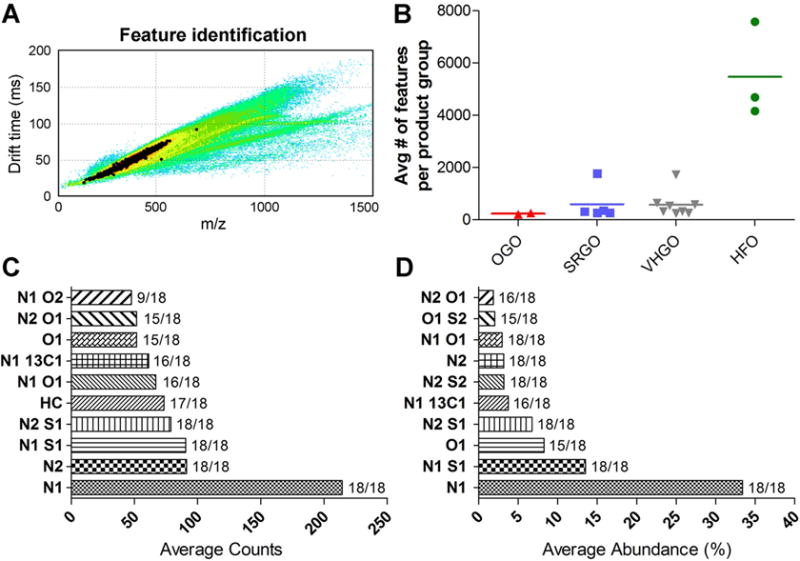
IM-MS data processing and global feature identification. Computational integration of IM-MS data sets in PetroOrg software (CON-20 shown as a representative example) enables identification of the unique features (highlighted in black) and quantitation of heteroatom class distribution for each sample (A). Plots in (B) depict the total number of features identified in each sample grouped into petroleum manufacturing streams. Averages for the top 10 most abundant heteroatom classes based on raw counts and relative abundance are shown in (C) and (D), respectively. The frequency of feature detection in the various petroleum substances is indicated.