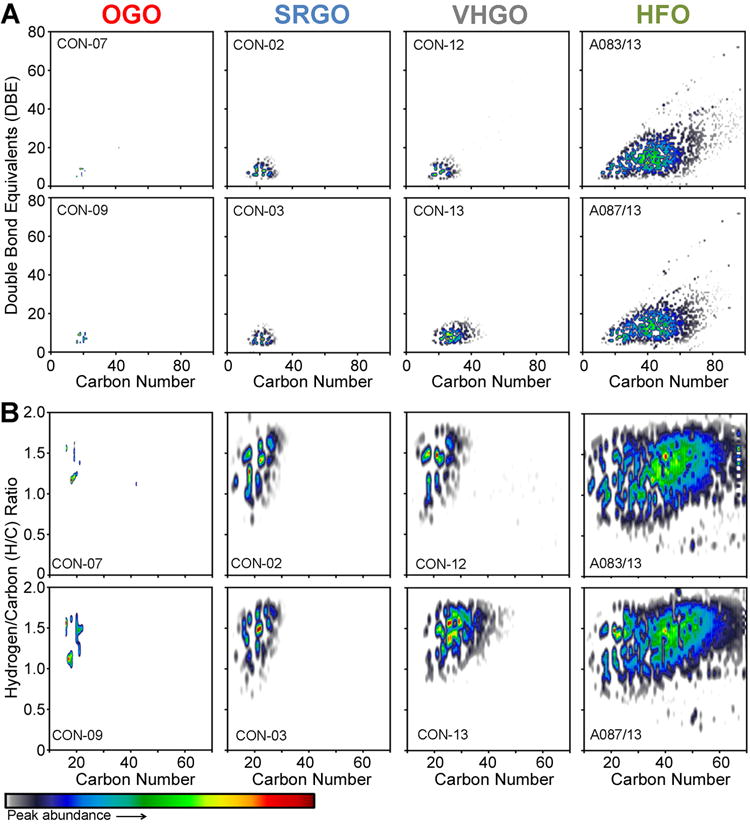
Figure 4.

Chemical composition-based grouping of petroleum substances. Plots visualize unique feature distributions for the N1 heteroatom class, i.e. carbon chain length vs double bond equivalents (DBE) (A) and carbon chain length vs hydrogen-to-carbon (H/C) ratio (B). Two representative samples for each of four manufacturing streams (OGO, SRGO, VHGO, and HFO) are shown. The feature density is reflected through increasing color intensity.
