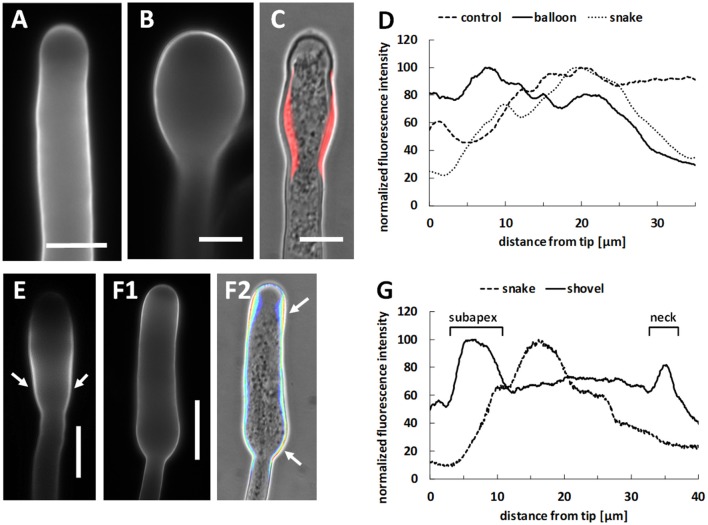
Figure 10.
Distribution of cellulose in Spm-treated pollen tubes. (A) Pattern of cellulose in control pollen tubes. (B) Cellulose distribution at the onset of Spm treatment (balloon stage). (C) Distribution of cellulose at the snake stage; in this case, fluorescence of cellulose was thresholded to evince the sites of major accumulation and superimposed to the DIC view of the same pollen tube in order to emphasize the sites of cellulose accumulation. (D) Graph of relative fluorescence intensity at the balloon/snake transition (compared to control) starting from the tip. Data are representative of three independent experiments (E) Image of a pollen tube at the snake stage showing accumulation of cellulose in the neck and in enlarged regions (arrows). (E,F1,F2) Representative image of a pollen tube at the shovel stage. Cellulose accumulates all along the pollen tube but more prominently in the subapex and in the neck regions (arrows) as shown by pseudocolored fluorescence signal merged with the DIC view. Bars in (A–C) 10 μm. Bar in (E,F1,F2) 20 μm. (G) Graph reporting the relative fluorescence intensity in pollen tubes at the shovel stage starting from the tip. The so-called “enlargement zone” represents the point where the diameter of that specific pollen tube increases. Data are representative of three independent experiments

