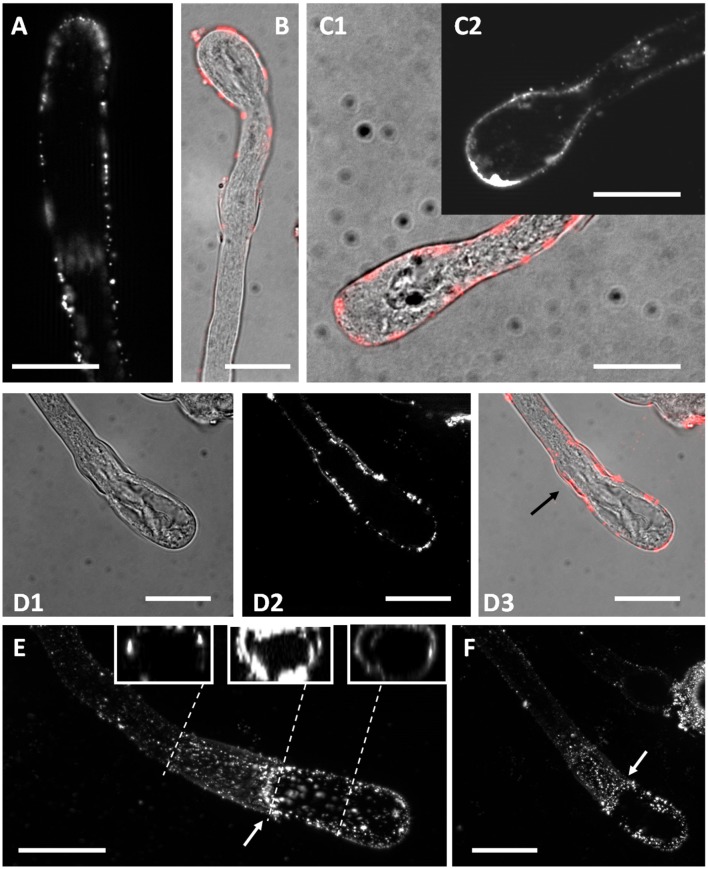
Figure 12.
Distribution of callose synthase in control and Spm-treated pear pollen tubes. (A) Callose synthase is present as dots or patches along the entire border of control pollen tubes. (B) At the balloon-like step, callose synthase accumulates in the spherical domain. This image is a merge of phase contrast and immunofluorescence (red) pictures of the same pollen tube. (C1,C2) Accumulation of callose synthase in the apical domain is more evident at the transition between the balloon-like and the shovel-like step. The image in (C1) is a merge of immunolocalized callose synthase (red) with phase contrast view of the same pollen tube. The image in (C2) is an immunofluorescence view of another pollen tube. (D1–D3) Accumulation of callose synthase in the neck (arrow) becomes evident when pollen tubes develop into the snake shape and start assuming the shovel shape. (E–F) Two additional views of Spm-treated pollen tubes showing a consistent accumulation of callose synthase in the neck region (arrows), with an annulus-like configuration. Bars = 10 μm. The insets in Figure 11E show three reconstructions from a Z-series stack demonstrating that the annulus does not have uniform fluorescence intensity. Data are representative of three independent experiments.

