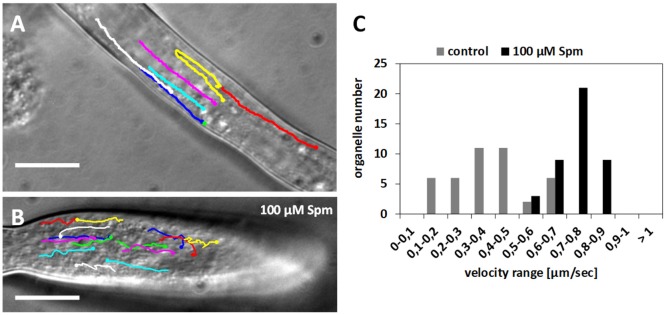
Figure 7.
Velocity distribution of organelles in control and Spm-treated pear pollen tubes. (A) Control pollen tube with lines indicating the pathway of some monitored organelles. (B) Pathway of some organelles in a Spm-treated pollen tube. Bars: 10 μm. (C) Velocity distribution of representative organelles in control and Spm-treated pollen tubes. The Y-axis indicates the number of organelles while the X-axis indicates the velocity (in μm sec−1).

