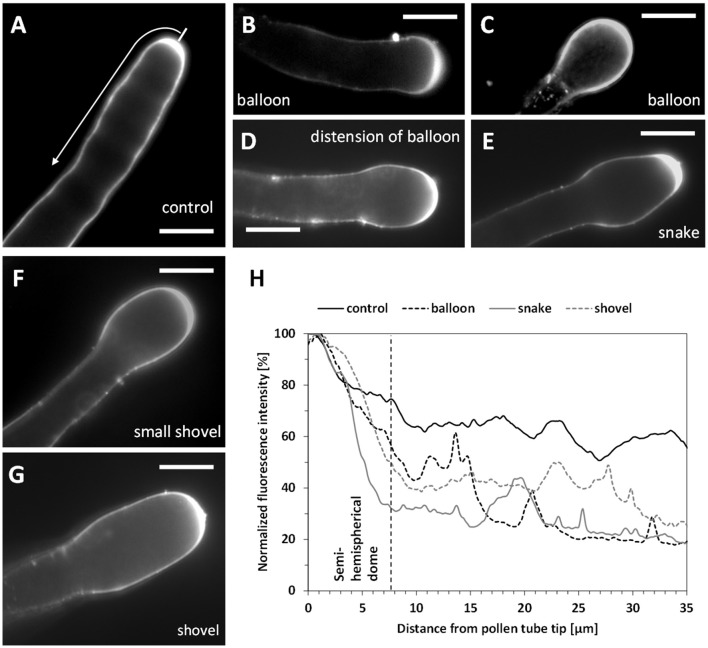
Figure 9.
Pectin distribution in control and Spm-treated pear pollen tubes. (A) Distribution of PI-stained cell wall polysaccharides in control pollen tubes. Arrow indicates the surface analyzed for PI fluorescence intensity. (B,C) Balloon stage. (D) A pollen tube resuming growth and switching from the balloon to the snake stage. (E) A typical example of a snake-shaped pollen tube. (F–G) Initial stage of shovel formation and a mature shovel-shaped pollen tube, in which PI-labeled pectins accumulate again in the tip. Bars for all pictures: 10 μm. (H) Relative quantitation of PI fluorescence intensity in pollen tubes treated with Spm. The intensity profile is reported as relative fluorescence intensity starting from the tip. The analyzed half curvature of the pollen tube apex is called a “semi-hemispherical dome.” Graphs are calculated for the main steps of Spm treatment as indicated by the graph legend. Data are representative of three independent experiments.

