
Fig. 9.
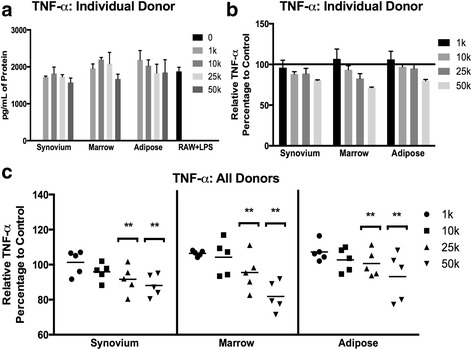
Immunomodulation of murine TNF-α by synovium, marrow, and adipose cMSCs. Passage 2 cMSCs (1 × 10³–50 × 103) were cocultured with 1 × 10⁴ murine macrophage cells in 12-well plates in CCM (n = 3 wells/condition). After 24 hours, LPS (0.5 μg/ml) was added to cocultures to activate macrophages. After 18 hours, media were collected and ELISA performed to determine the concentration of secreted murine TNF-α. a Representative murine TNF-α concentrations (mean ± SD) for an individual donor. RAW + LPS denotes TNF-α concentration from murine macrophages (RAW cells) in the absence of cMSCs (positive control). b Data from a were transformed to reflect the percentage change in TNF-α relative to the RAW + LPS positive control in preparation for comparative analysis across all 15 cMSC preparations, reported as mean ± SD. c Scatter plots demonstrating the percentage change of TNF-α concentration relative to positive control for all 15 cMSC preparations, organized by tissue and number of cMSCs present within cocultures. Each data point represents the relative murine TNF-α for an individual cell preparation and “dose” of cMSC (bar = mean across the five donors). For all three tissues, TNF-α concentrations decreased in response to increasing numbers of cocultured cMSCs. Significant differences between numbers of cocultured cMSCs: **p < 0.01. LPS lipopolysaccharide, TNF-α tumor necrosis factor alpha