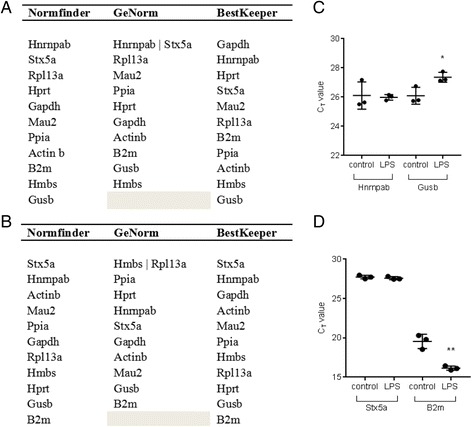
Fig. 2.

Stability ranking of reference genes in control and LPS stimulated BMDMs at 6 h and 24 h by Normfinder, GeNorm and BestKeeper softwares. Ct values were recorded for control and LPS stimulated (10 ng/ml) BMDMs at 6 h and 24 h. Ct values were transformed as instructed and applied to each reference gene analysis software. The tables above show the ranking of most to least stably expressed reference genes between control and LPS stimulated cells, from top to bottom, as identified by Normfinder, GeNorm and BestKeeper softwares, at (a) 6 h and (b). 24 h. The most and least stable reference genes were identified by NormFinder from an initial data set at 6 h and 24 h. The stability in expression levels of these selected genes were then analysed in an independent experiment by RT-qPCR and Ct values are shown at 6 h (c) and 24 h (d). The error bars represent means ± SD. The significance values were calculated by comparison of control and LPS treated samples as a group, at each time point. *p < 0.05, **p < 0.01
