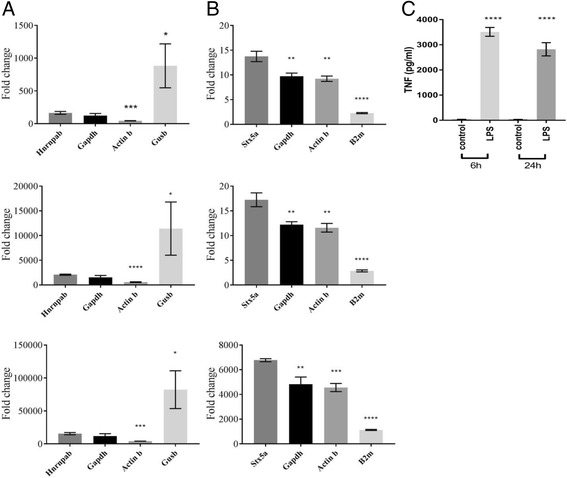
Fig. 4.

Fold change in TNF, IL-1β and NOS2 gene expression levels at 6 h and 24 h as calculated using different reference genes. Fold change in expression of TNF (top row), IL-1β (middle row) and NOS2 (bottom row) in the LPS treated group, as compared to the control group, at (a) 6 h and (b). 24 h, was calculated using the ΔΔCt method, as described in the methods section. For normalisation, the most (Hnrnpap, Stx5a) and least consistently expressed reference genes (Gusb, B2m), as identified by Normfinder software analysis, and the traditional choice of Actinb and Gapdh were used for the calculation of ΔCt. (c). The release of TNF from control and LPS stimulated BMDM was measured by ELISA at 6 h and 24 h of LPS exposure. Bars represent the mean ± SD. *p ≤ 0.05, **p ≤ 0.01, ***p ≤ 0.001, ****p ≤ 0.0001
