Fig. 3.

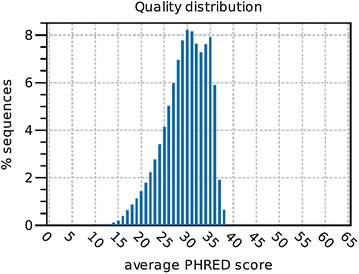
The quality of Prototheca wickerhamii POL-1 genomic DNA sequence. The x-axis represents the PHRED quality score and the y-axis represents the percentage of sequences with a quality score, normalized to the total number of sequences

The quality of Prototheca wickerhamii POL-1 genomic DNA sequence. The x-axis represents the PHRED quality score and the y-axis represents the percentage of sequences with a quality score, normalized to the total number of sequences