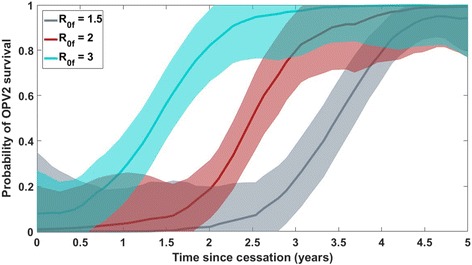
Fig. 2.

Estimated probability with uncertainty of OPV2 survival for R 0f = 1.5 (gray), 2.0 (red), and 3.0 (cyan), vs. the time since cessation, at a fixed value of 0.001 for the mean per-person, per-day migration rate (or y = –3 on the log-space y-axes in Figs. 1, 3, 4, and 5). The red line and corresponding uncertainty band correspond to the estimated probability of OPV2 survival along a slice at y = –3 through the colored separatrix surface presented in Fig. 1; the cyan and gray areas represent the same quantity for simulated scenarios run with different values of the final VDPV infectivity. The other scenario parameters are set to g = 0.5, λ = 60 days, N IPV = 1, c = 1. The uncertainty bands represent uncertainty on the estimated probability of the OPV2 survival outcome at a given point in parameter space and do not incorporate uncertainty in the simulation input parameters themselves or other extrinsic sources of uncertainty
