
Fig. 1.
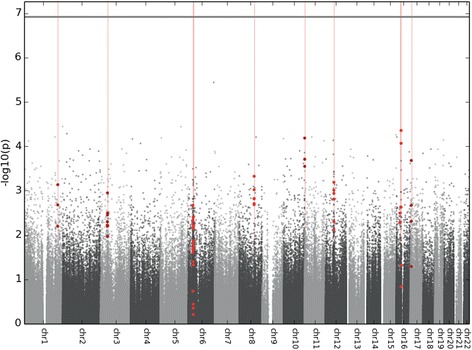
Manhattan plot showing the −log10 p values for all CpG probes and their genomic locations included in the genome-wide methylation analysis (n = 414,733). The false discovery rate p value threshold is represented by a horizontal line. Vertical lines and overlaid bold dots correspond to differentially methylated regions (DMRs) identified by comb-p, as represented in Table 2 [25]