Abstract
Amygdala plays an important role in fear and emotional learning, which are critical for human survival. Despite the functional relevance and unique circuitry of each human amygdaloid subnuclei, there has yet to be an efficient imaging method for identifying these regions in vivo. A data-driven approach without prior knowledge provides advantages of efficient and objective assessments. The present study uses high angular and high spatial resolution diffusion magnetic resonance imaging to generate orientation distribution function, which bears distinctive microstructural features. The features were extracted using spherical harmonic decomposition to assess microstructural similarity within amygdala subfields are identified via similarity matrices using spectral k-mean clustering. The approach was tested on 32 healthy volunteers and three distinct amygdala subfields were identified including medial, posterior-superior lateral, and anterior-inferior lateral.
Keywords: Diffusion, Amygdala, Parcellation, Spectral Clustering, Subfield, Orientation Distribution Function, Spherical Harmonic
1 Introduction
The amygdala, a subcortical structure in the human brain, is associated with fear and emotional learning [1]; with such, it regulates social behavior and perception, and memory consolidation in other brain regions [2]. These functionalities of amygdala, especially fear learning and conditioning, are critical for survival. Functionally distinct subfields compose the whole amygdala, coarsely separated into the lateral, basolateral, and centromedial nuclei [3]. The lateral and basolateral nuclei receive afferent fibers that deliver highly processed sensory information from cortices while the centromedial nuclei project efferent fibers to hypothalamus and limbic nuclei. Conventionally, our knowledge of amygdala and its subfields has been derived from studies of compromised human brain using direct electrical stimulation [4]. Thus, having an accessible approach for imaging amygdala is valuable for advancing amygdala research in vivo.
In vivo studies of function and structure of the human amygdala have been made possible through neuroimaging, notably functional magnetic resonance imaging (fMRI) and diffusion magnetic resonance imaging (dMRI). The whole amygdala appears as a compact small region of grey matter in conventional magnetic resonance T1-weighted (T1W) imaging. Finer granularity of amygdala subfields may be parceled using ultra-high resolution T1W imaging [5], dMRI probability tractography [6, 7], or combining tasked fMRI and diffusion tensor imaging (DTI) streamline tractography [8]. These studies, however, require priori knowledge. The ultra-high resolution T1W imaging segmentation requires manually tracing with prior knowledge of amygdala histology; studies involving dMRI tractography call for pre-defined amygdala-cortical projections.
Alternatively, a data-driven approach without prior knowledge provides advantages of efficient and objective assessments. Spectral clustering algorithm has been applied to DTI principle directions (i.e., major eigenvector of the diffusion tensor), and yielded two directionally coherent subfields separated by a boundary called septa [9]. However, in the DTI framework, the water diffusion is approximated by an ellipsoid with a major eigenvector representing an overall direction of underlying microstructural organization [10]. Thus, local complexity and important features of microstructures may be lost in the simplified tensor model [11, 12]. To overcome DTI limitations, orientation distribution function (ODF) was proposed [13–18]. Compared to DTI major eigenvector, which has only three vector components, ODF describes a three-dimensional diffusion probability function defined on the surface of a unit sphere. ODF elucidates complex microstructures with multiple crossing and their probability distribution, and is believed to provide richer and more complete information of diffusion directionality.
In this study, ODF is used to parcel amygdala subfields that have similar microstructural characteristics. Specifically, ODF is first decompose to a combination of spherical harmonics, from which features of the ODF surface will be extracted. Similar to Fourier basis functions (i.e., a series of sinusoidal functions), the spherical harmonic basis functions are orthogonal with each other, and their coefficients describe distinctive features of the ODF surfaces. Coefficients of spherical harmonics have been used to segment the brain into different levels of microstructural complexity [19, 20]. Herein, we use the spherical harmonic coefficients to assess similarity between imaging voxels within amygdala. Amygdala subfields are identified via similarity matrices using spectral k-mean clustering [21]. We tested our approach on healthy volunteers who received high angular and high spatial resolution diffusion imaging.
2 Material and Methods
2.1 Data Acquisition
MRI scans were performed on 32 healthy volunteers at a 3.0T Phililps Achieva INTERA scanner with a 32-channel head coil. Written informed consent was obtained from all participants in accordance with ethical approval from the Dartmouth College Internal Review Board.
High spatial resolution dMRI sequence was acquired with a single-shot spin-echo echo-planer imaging sequence at an isotropic voxel size of 1.6mm with four repetitions (TE/TR=79/3382, FOV=230mm×230mm×35.2mm, in-plane matrix size = 114×114, 22 slices). Diffusion-weighted (DW) images were acquired at one b-value = 0 s/mm2 (b0) and 61 noncollinear DW directions at b-value = 1000 s/mm2 with a total acquisition time of 45 minutes. Other imaging protocols included: A matched field-of-view (FOV) gradient-echo sequence with 2-echo times (TE = 7 and 8 ms) to generate fieldmap to correct for dMRI geometric distortion; and a whole brain T1W image using a magnetization-prepared rapid acquisition gradient echo sequence (MP-RAGE) with TE/TR= 3.72/8.18ms, FOV=224mm×224mm×220mm, and isotropic voxel size of 1 mm.
2.2 Post-processing
Motion correction, eddy current correction and susceptibility distortion correction were applied to each volume of the DW images before averaging over the four repetitions using the toolbox in FSL (FMRIB Software Library, University of Oxford, http://fsl.fmrib.ox.ac.uk/fsl/). Motion and eddy current distortion were corrected using a linear registration to the b0 image (eddy_correct, FSL) for each volume within each repetition. Susceptibility distortion was corrected by calculating the geometric distortion and signal loss from the field map and was compensated for on the DW images (fudge, FSL). A final motion correction was applied to all four repetitions by rigidly registering the b0 images from each repetition before averaging.
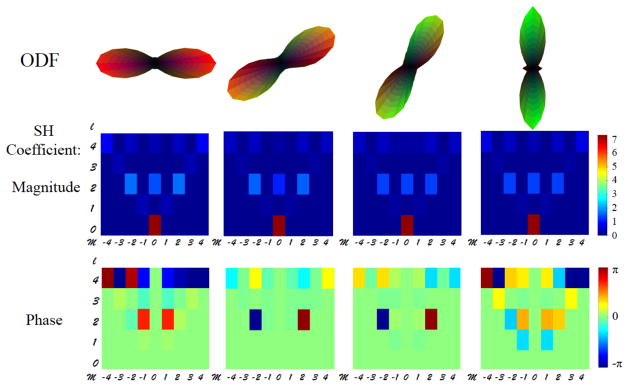
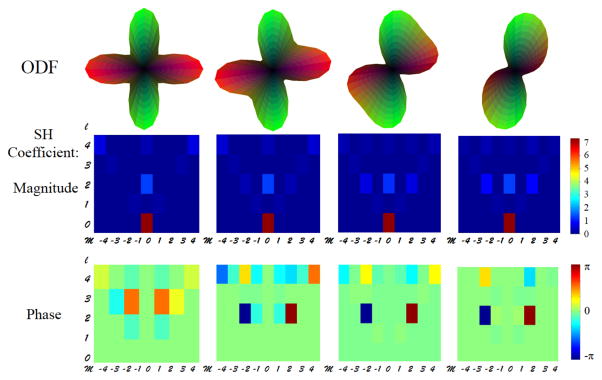
In the diffusion space, the averaged DW images were then used to calculate the structural ODF profiles of the amygdala using in-house MATLAB programs [22] with a Q-ball Imaging (QBI) algorithm [14]. Spherical Harmonics (SH) coefficients of each ODF profile were extracted up to an order of 6, i.e., lmax =6. As a symmetric ODF was assumed and odd orders contain only noise information, only coefficients of even orders were kept [19, 20]. A total of 28 SH coefficient pairs (i.e., magnitude and phase) that represent the shape and orientation of ODF in each voxel were entered into the subsequent spectral clustering. Fig. 1 shows simulated ODFs of single fiber orientation (0°, 30°, 60°, 90°) and their SH coefficients. Fig. 2 shows simulated ODFs for crossing fibers with rotating 2nd fiber (0°, 30°, 60°, 90°) and their SH coefficients. Consistent to observations described in [19], the shape (e.g., number of crossing fibers) and the orientation (e.g., rotation angle) of ODF are described by the combination of magnitude and phase components of the SH coefficients.
Fig. 1.
The top panel shows simulated ODFs of single fiber orientation (0°, 30°, 60°, 90°). The ODFs were simulated with single tensor of axial diffusivity of 1200 mm2/s and radial diffusivity of 250 mm2/s at b=2500 s/mm2. The middle panel shows magnitude components of SH coefficients. The bottom panel shows phase components of SH coefficients. l and m are orders of Legendre function in the spherical harmonic bases. For Illustrating purpose, SH coefficients of l = 0 to 4 and m = −l to l are shown here.
Fig. 2.
The top panel shows simulated ODFs for crossing fibers with rotating 2nd fiber (0°, 30°, 60°, 90°). The ODFs were simulated with two tensors at b=2500 s/mm2 and each has axial diffusivity of 1200 mm2/s and radial diffusivity of 250 mm2/s. The middle panel shows magnitude components of SH coefficients. The bottom panel shows phase components of SH coefficients. l and m are orders of Legendre function in the spherical harmonic bases; and SH coefficients of l = 0 to 4 and m = −l to l are shown here.
2.3 Amygdala Segmentation
The amygdala probability mask was first obtained from the Harvard-Oxford subcortical structural Atlas provided in FSL in the MNI 152 standard space. The mask was then warped to the subject diffusion space through the transformation achieved by aligning T1W of each subject to the T1W in MNI space using nonlinear registration (fnirt, FSL). A threshold of 50% was then applied to the probability mask to exclude extraneous tissue. The resulting masks were conservatively away from the edge to avoid alignment errors and imaging partial voluming.
2.4 Amygdala Parcellation: K-mean Spectral Clustering
For each voxel, 28 SH coefficient pairs (lmax=6, even orders) were used to characterize the ODF that reflects the diffusion characteristics determined by the underlying tissue microstructure. Voxels within the mask of the amygdala would be grouped together according to the similarity of their SH coefficients.
To prepare for the subsequent Laplacian transformation of Spectral Clustering, the graph similarities (Sij) between two voxels i, j were computed by converting the weighted pair-wise Pearson’s correlation coefficient, Cij of the SH coefficients according to their spherical distance [21]. The weighting, Wij, is to adjust physical (Euclidean) distance between voxels i, j. The dimension of S matrix, M × M, equals to the number of voxels within the segmented amygdala.
| (1) |
Sigma is a threshold parameter that deems the important cells in C where values below sigma are penalized. Therefore, S is a sparser matrix than C while also preserves the correlation as higher similarity Sij was achieved when the two voxels i, j had similar SH coefficients and were physically close to each other. The value of sigma was optimized by iteratively incrementing sigma until minimum Fiedler Value of the Laplacian matrix (see below or [21]) was achieved.
The graph similarity matrix (S) of each subject was then transformed into normalized symmetric graph Laplacian matrix, on which eigen decomposition was performed. According to spectral clustering theory [21], the first few ordered eigen values contain critical structural information regarding the data. To determine the number of eigen values that best reflect the underlying structure, we tested the eigen values against those generated from unstructured data. The unstructured data were generated by randomizing the SH coefficients. The randomization process was bootstrapped for 1200 iterations to create a null distribution of eigenvalues of the unstructured Laplacian matrices. For each subject, eigenvalues of original “structured” Laplacian matrix were tested against the null distribution using z-scoring, and the number of significant eigenvalues were determined as the number of clusters, denoted as N.
To perform k-mean clustering to classify the voxels within the amygdala, we picked the N eigenvectors corresponding to the N eigenvalues starting from Fiedler Value. Each eigen-vector has M elements that equals to the dimension of the Laplacian and S matrix. Note that M also denotes the number of voxels within the segmented amygdala. The N eigen-vectors were stacked up to form a N × M matrix. Thus, the N × M matrix described N distinct features for M voxels. K-mean clustering was performed across M voxels to yield a cluster label for each voxel. The clustering would then be complete and yield N amygdala subfields for each subject in the native space. In order to check the inter-subject variability, the individual results were transformed to the template brain. Individual clusters were averaged across subjects to generate a consistency map.
3 Results
Consistently three eigenvalues of the Laplacian transformed similarity matrix were found to be statistically significant across 32 subjects with p < 0.001. Such significance indicated that there was a consistent pattern whose optimal solution was related to the three eigenvalues. Therefore, N=3 was the optimal cluster number found for this study. In addition, we found that this N was independent from the sigma during the iterative optimization process where we found sigma = 0.55 gives minimal Fiedler Value.
The ODF profiles of the right amygdala with various orientations, shapes, and peaks are shown in Fig. 3. The ODFs were overlaid on the results of the clustering algorithm from one subject on an axial slice. It can be seen that groups of amygdala voxels show characteristically different orientations and shapes of the ODF that were associated with fiber structures.
Fig. 3.
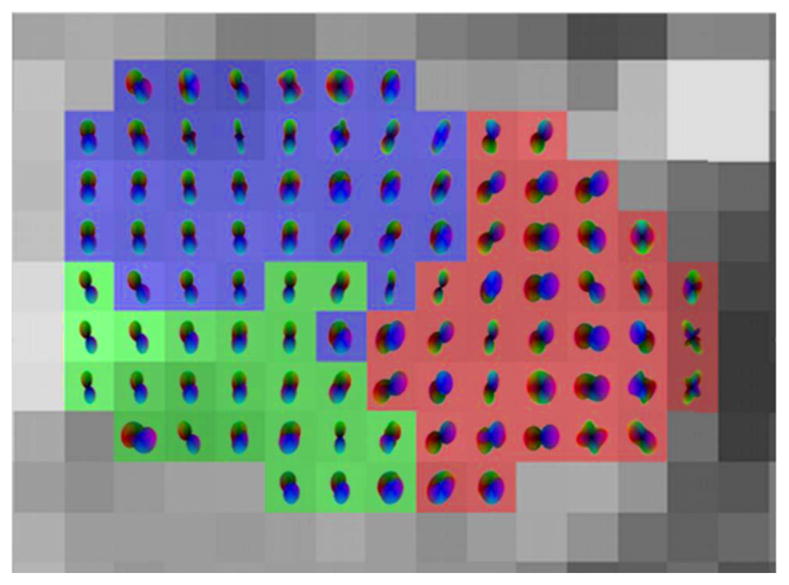
Right amygdala (axial view) with ODF overlaid on T1W for one subject.
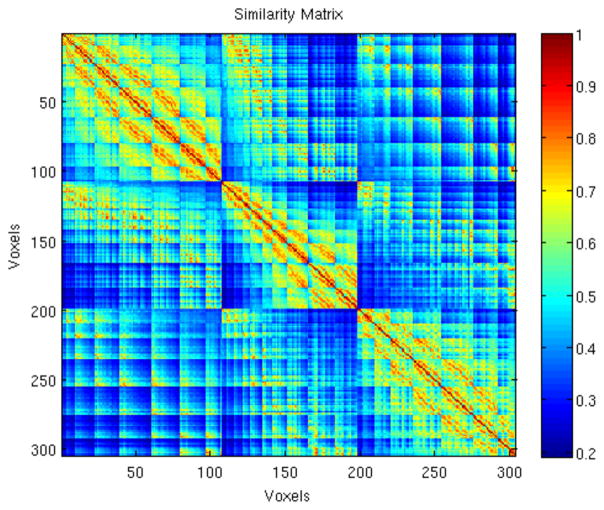
The similarity matrix (S) calculated from the SH coefficients of the ODF profiles as described in 2.4 of the same subject in Fig. 3 is shown in Fig. 4. Red suggests high similarity. Three clusters are noticeable, which corresponded to three regions with distinct ODF characteristics. As the similarity matrix also contains voxel correspondence, it demonstrates consistent region separations as well.
Fig. 4.
The similarity matrix, S (300×300), of a subject’s amygdala with 300 voxels for cluster number N=3. Three distinct regions are noticeable. Red suggests high similarity.
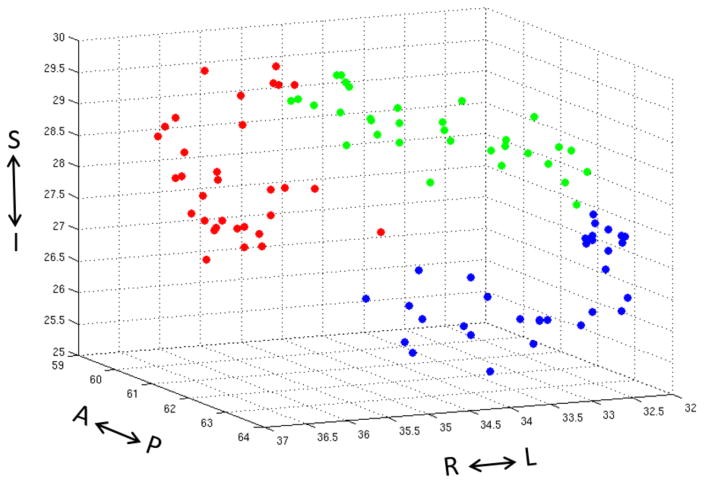
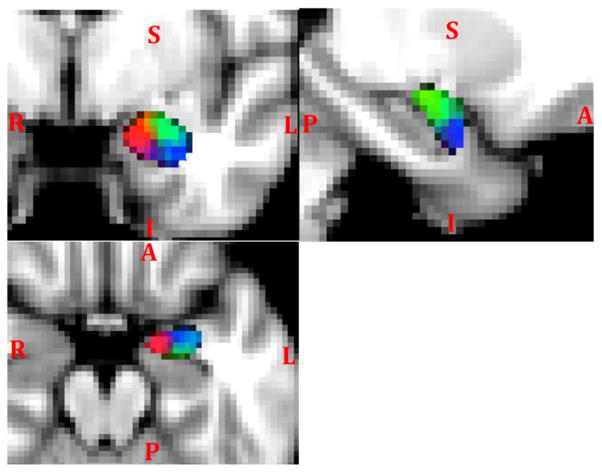
The 3D scatter plot of the center of masses of each cluster across subjects is shown in Fig. 5. The coordinates are in voxels and were oriented to match with the image in coronal view (top-left) in Fig. 6. The spatial distribution of the center of masses may be a measure of across subject consistency. Alternatively, Fig. 6 shows the consistency map of clusters across subjects overlaid on coronal, sagittal, and axial T1W slices for the left amygdala. It clearly shows three clusters as the following subfields: medial (red), posterior-superior-lateral (green), anterior-inferior-lateral (blue).
Fig. 5.
3D scatter plot of cluster center of masses across subjects. Coordinates are by image voxels in the standard MNI space. The color code and orientation of the scatter plot match with the image in coronal view (top -left) in Fig. 6.
Fig. 6.
Consistency map of the three clusters in the left amygdala across subjects in coronal (top-left), axial (bottom), and sagittal (top-right) views.
4 Discussion and Conclusions
This study demonstrates that with high angular and spatial resolution diffusion imaging, amygdala can be parceled into three subfields. The automated clustering uses only microstructural information within the amygdala and does not require prior knowledge of histology or cortical functional projections of amygdaloid subnuclei. The physical locations of the three subfields infer three subnuclei including lateral, basolateral, and centromedial nuclei. However, further study is warranted to further validate their cortical projections by incorporating dMRI tractography to link each cluster to functionally relevant cortical regions and to compare with histologically defined subnuclei.
Footnotes
Supported in part by Dartmouth Synergy, Indiana Alzheimer Disease Center pilot grant, NIH R01 MH080716, R01 EB022574, R01 LM011360, R01 AG19771 and P30 AG10133.
References
- 1.Aggleton JP. The amygdala: neurobiological aspects of emotion, memory, and mental dysfunction. New York: Chichester: Wiley-Liss; 1992. p. xii.p. 615. [Google Scholar]
- 2.Barr ML, Kiernan JA. The human nervous system: an anatomical viewpoint. 6. Philadelphia: Lippincott; 1993. p. vii.p. 451. [Google Scholar]
- 3.Pitkanen A, Savander V, LeDoux JE. Organization of intra-amygdaloid circuitries in the rat: an emerging framework for understanding functions of the amygdala. Trends Neurosci. 1997;20(11):517–23. doi: 10.1016/s0166-2236(97)01125-9. [DOI] [PubMed] [Google Scholar]
- 4.Whalen PJ, et al. Functional neuroimaging studies of the amygdala in depression. Semin Clin Neuropsychiatry. 2002;7(4):234–42. doi: 10.1053/scnp.2002.35219. [DOI] [PubMed] [Google Scholar]
- 5.Entis JJ, et al. A reliable protocol for the manual segmentation of the human amygdala and its subregions using ultra-high resolution MRI. Neuroimage. 2012;60(2):1226–35. doi: 10.1016/j.neuroimage.2011.12.073. [DOI] [PMC free article] [PubMed] [Google Scholar]
- 6.Saygin ZM, et al. Connectivity-based segmentation of human amygdala nuclei using probabilistic tractography. Neuroimage. 2011;56(3):1353–61. doi: 10.1016/j.neuroimage.2011.03.006. [DOI] [PMC free article] [PubMed] [Google Scholar]
- 7.Bach DR, et al. Deep and superficial amygdala nuclei projections revealed in vivo by probabilistic tractography. J Neurosci. 2011;31(2):618–23. doi: 10.1523/JNEUROSCI.2744-10.2011. [DOI] [PMC free article] [PubMed] [Google Scholar]
- 8.Balderston NL, et al. Functionally distinct amygdala subregions identified using DTI and high-resolution fMRI. Soc Cogn Affect Neurosci. 2015;10(12):1615–22. doi: 10.1093/scan/nsv055. [DOI] [PMC free article] [PubMed] [Google Scholar]
- 9.Solano-Castiella E, et al. Diffusion tensor imaging segments the human amygdala in vivo. Neuroimage. 2010;49(4):2958–65. doi: 10.1016/j.neuroimage.2009.11.027. [DOI] [PubMed] [Google Scholar]
- 10.Basser PJ, Mattiello J, LeBihan D. MR diffusion tensor spectroscopy and imaging. Biophys J. 1994;66(1):259–67. doi: 10.1016/S0006-3495(94)80775-1. [DOI] [PMC free article] [PubMed] [Google Scholar]
- 11.Wu YC. Medical Physics. University of Wisconsin-Madison; Madison: 2006. Diffusion MRI: Tensors and Beyond; p. 150. [Google Scholar]
- 12.Tournier JD, Mori S, Leemans A. Diffusion tensor imaging and beyond. Magn Reson Med. 2011;65(6):1532–56. doi: 10.1002/mrm.22924. [DOI] [PMC free article] [PubMed] [Google Scholar]
- 13.Alexander DC. Multiple-fiber reconstruction algorithms for diffusion MRI. Ann N Y Acad Sci. 2005;1064:113–33. doi: 10.1196/annals.1340.018. [DOI] [PubMed] [Google Scholar]
- 14.Tuch DS. Q-ball imaging. Magn Reson Med. 2004;52(6):1358–72. doi: 10.1002/mrm.20279. [DOI] [PubMed] [Google Scholar]
- 15.Tournier JD, et al. Direct estimation of the fiber orientation density function from diffusion-weighted MRI data using spherical deconvolution. Neuroimage. 2004;23(3):1176–85. doi: 10.1016/j.neuroimage.2004.07.037. [DOI] [PubMed] [Google Scholar]
- 16.Hess CP, et al. Q-ball reconstruction of multimodal fiber orientations using the spherical harmonic basis. Magn Reson Med. 2006;56(1):104–17. doi: 10.1002/mrm.20931. [DOI] [PubMed] [Google Scholar]
- 17.Wedeen VJ, et al. Mapping complex tissue architecture with diffusion spectrum magnetic resonance imaging. Magn Reson Med. 2005;54(6):1377–86. doi: 10.1002/mrm.20642. [DOI] [PubMed] [Google Scholar]
- 18.Rathi Y, et al. Directional functions for orientation distribution estimation. Med Image Anal. 2009;13(3):432–44. doi: 10.1016/j.media.2009.01.004. [DOI] [PMC free article] [PubMed] [Google Scholar]
- 19.Frank LR. Characterization of anisotropy in high angular resolution diffusion-weighted MRI. Magn Reson Med. 2002;47(6):1083–99. doi: 10.1002/mrm.10156. [DOI] [PubMed] [Google Scholar]
- 20.Alexander DC, Barker GJ, Arridge SR. Detection and modeling of non-Gaussian apparent diffusion coefficient profiles in human brain data. Magn Reson Med. 2002;48(2):331–40. doi: 10.1002/mrm.10209. [DOI] [PubMed] [Google Scholar]
- 21.von Luxburg U. A Tutorial on Spectral Clustering. Statistics and Computing. 2007;17(4):395–416. [Google Scholar]
- 22.Wu YC, Field AS, Alexander AL. Computation of diffusion function measures in q-space using magnetic resonance hybrid diffusion imaging. IEEE Trans Med Imaging. 2008;27(6):858–65. doi: 10.1109/TMI.2008.922696. [DOI] [PMC free article] [PubMed] [Google Scholar]


