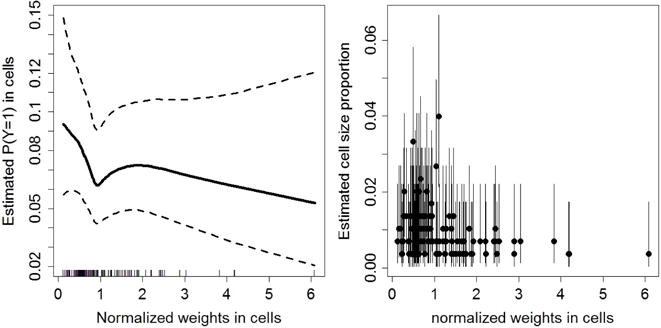
Fig. 4.

Estimated cell probabilities obtained via (13) with PS together with the 95% credible intervals (left panel) and cell size proportions obtained via (20) (right panel) for the district of Nivelles using the model-based approach. In the right panel, the dots indicate the posterior mean and the black vertical lines are the 95% credible intervals.
