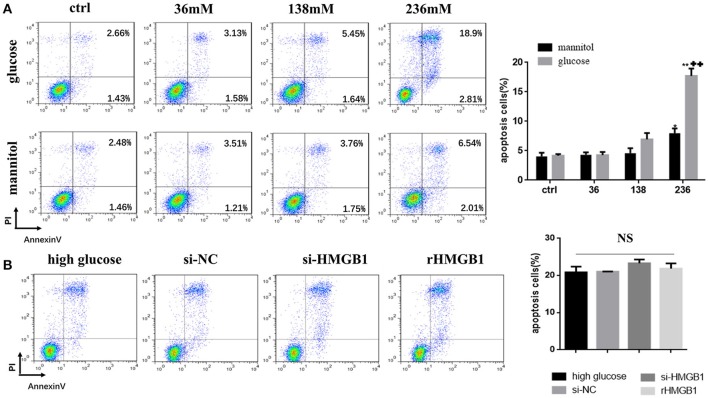
Figure 4.
(A) Effect of high glucose or mannitol on MC apoptosis was measured by flow cytometry. Representative dot plots are shown, and percentage of cells positive for Annexin-V or positive for both Annexin-V and propidium iodide (PI) are represented as a histogram. Values are expressed as mean ± SEM (n = 3), *p < 0.05 vs. ctrl; **p < 0.01 vs. ctrl; ++p < 0.01 vs. 236 mM mannitol. (B) Apoptotic rate of high-glucose-treated MCs transfected with HMGB1 siRNA or incubated with rHMGB1 was tested by flow cytometry. NS means no significant difference.

