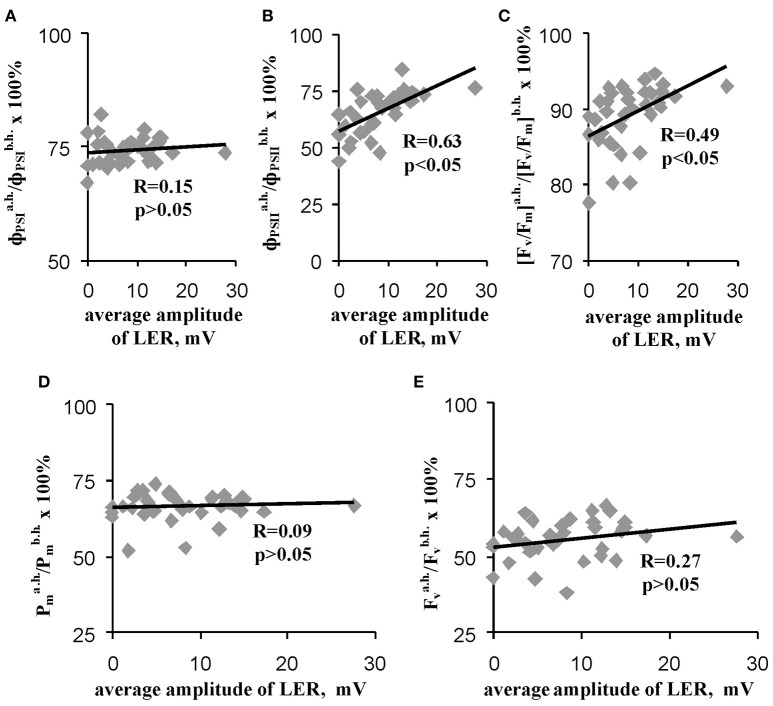
Figure 7.
Scatter plots between average amplitudes of LER and relative quantum yields of photosystems I (A) and II (B), the relative maximal quantum yield of photosystem II (C) and relative quantities of undamaged photosystems I (D) and II (E) after heating (n = 40). The average amplitude of LER was calculated for the each plant during the stepped heating. It has been assumed that the average amplitude equaled zero when LERs were absent in the plant. R is Pearson's correlation coefficient.

