
Figure 9.
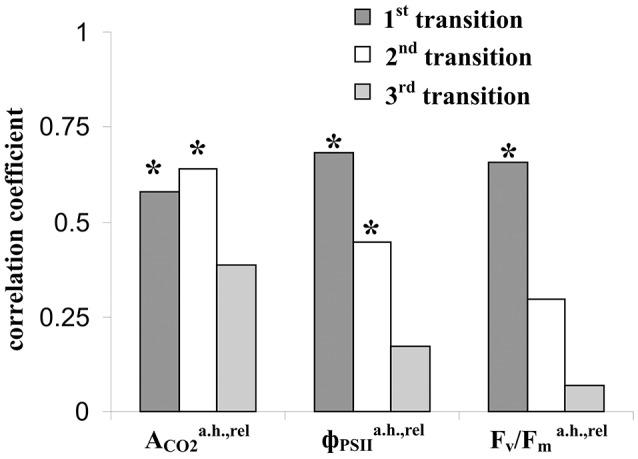
Coefficients of correlation of amplitudes of LERs, induced by different temperature transitions, with the relative residual photosynthetic assimilation of CO2 (), effective () and maximal (Fv/) quantum yields of photosystem II after heating. The group with LER observed during the 1st transition included 18 peas (n = 18), the group with LER observed during the 2nd transition included 32 peas (n = 32), and the group with LER observed during the 3rd transition included 23 peas (n = 23). Individual amplitudes of LERs for the each temperature transition in the each plant were used. *The correlation coefficient is significant.