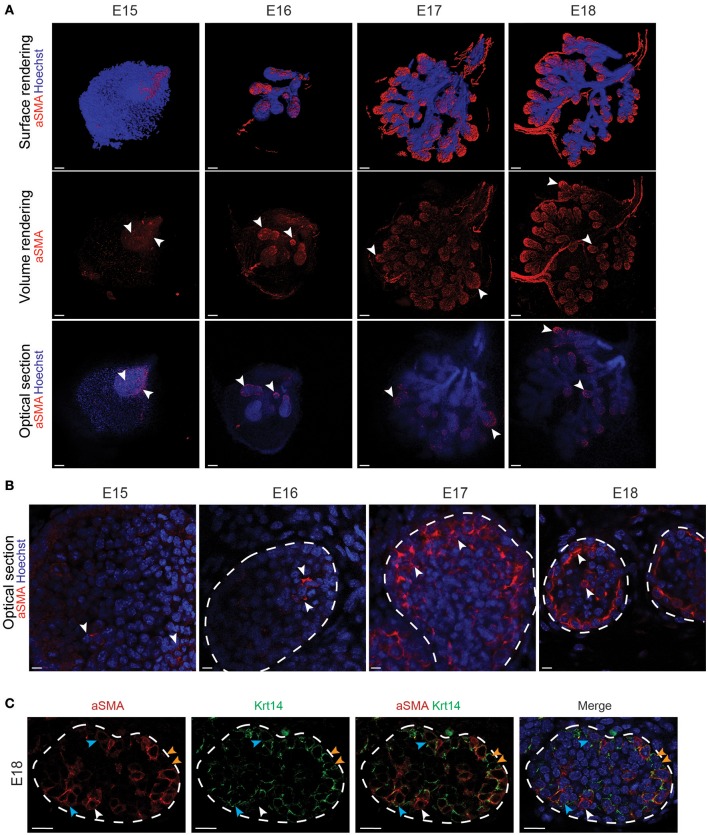
Figure 3.
aSMA is expressed in the basal cell layer and partially overlaps with Krt14 expression during LG epithelial compartment morphogenesis. (A) Whole-mount immunostaining show the localization of aSMA+ cell population from E15 to E18. The 3D surface renderings demonstrate the presence of aSMA mainly in the forming TEBs. Optical sections confirm the restriction of the aSMA+ cell population to the TEBs (white arrowheads). The ducts remain aSMA negative. (B) Close-up visualizations show aSMA repartition within the epithelial cell layers. At E15, aSMA is scarcely expressed in the epithelial bud. aSMA expression increases along with branching morphogenesis, and gets progressively restricted to the basal layer of the TEBs from E16 onwards (white arrowheads). (C) A close-up on the TEBs at E18 shows that aSMA and Krt14 localization partially overlap and define three cell populations in the embryo: aSMA single positive cells (white arrowheads), Krt14 single positive cells (blue arrowheads), and double positive cells (orange arrowheads). Scale bars: (A) 100 μm; (B,C) 20 μm.

