Figure 5.
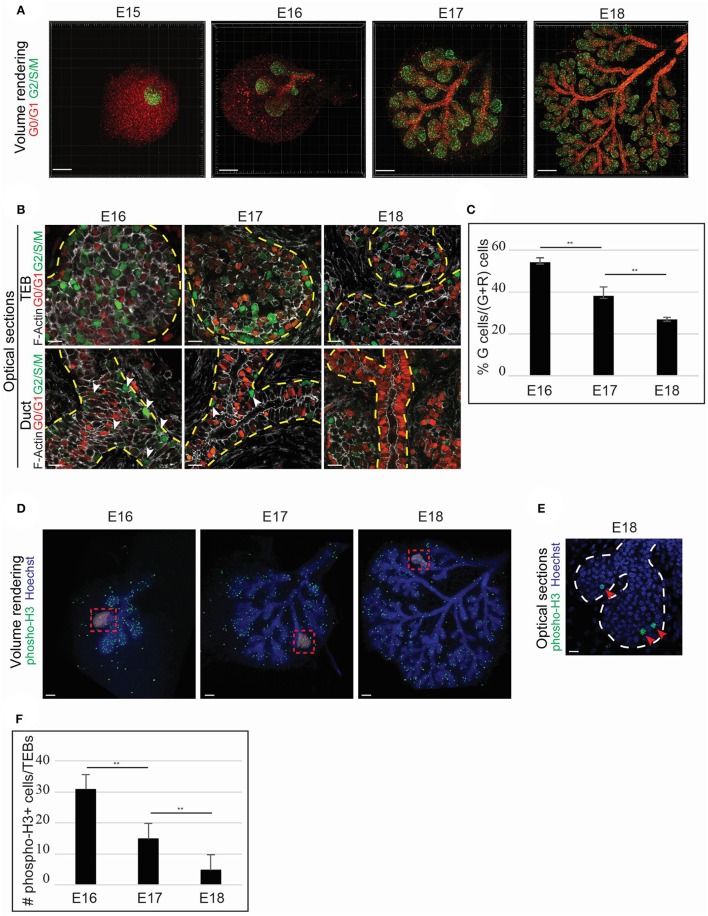
TEB cell proliferation fuels LG epithelial morphogenesis. (A–C) The Fucci system allows the visualization of cells in G0/G1 (nuclear red) and S/G2/M (nuclear green) phases and is used to monitor changes in the proliferation status during LG morphogenesis. (A) Volume rendering of E15 to E18 Fucci LGs. Proliferation occurs mainly in the epithelial compartment. At E15, the LG epithelial bud depicts majority of cells in G2/S/M. When branching morphogenesis starts (from E16 onwards), the ductal compartment reveals a higher number of G1/G0 cells, while the TEBs are mostly undergoing proliferation. (B) Close-up on optical sections. The TEBs show proliferative cells both in basal and suprabasal layers in all the studied stages. However, majority of the cells in the ductal compartment are in G0/G1. At E16 and E17, some cells in G2/S/M can be observed in the ducts (white arrowheads), but close to no cells are proliferating in the ductal compartment at E18. (C) The quantification of fluorescent cells in the TEBs demonstrates a clear diminution of the proliferation from E16 to E18. At E16, 54.5% of the cells are proliferating. Proliferation decreases to 38.2% at E17, and to 27.2% at E18. (D–F) Phospho-Histone3 whole mount immunostaining display a similar trend in the LG proliferation status from E16 to E18. (D) Volume renderings show that phospho-Histone3 positive cells are mainly localized in the epithelial compartment. Insets give an example for the quantification analysis: red dots (false color) correspond to each phospho-Histone3 positive nuclei. (E) Close-up on optical section. TEBs shows proliferating cells at E18. (F) Similarly to the Fucci analysis, the quantification of phospho-Histone3 positive cells demonstrates a decrease in the TEB proliferative state along with branching morphogenesis. At E16, about 30 cells/TEBs on average are phospho-H3 positive. The number of phospho-H3 positives cells decreases to <15 cells/TEBs at E17, and to 5 cells/TEBs at E18. Scale bars: (A) 200 μm; (B,E) 20 μm; (D) 100 μm. **p < 0.001 were considered as statistically significant (Student's t-test). Error bars represent standard deviations (n = 9 TEBs/time point). Dotted lines delimitate epithelial regions.

