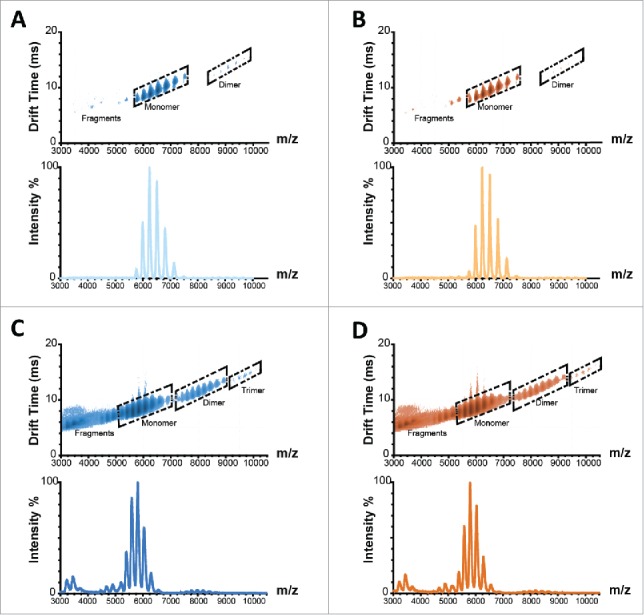
Figure 4.

Ion mobility spectra and corresponding mass to charge spectrograms of Remicade® (A) and Remsima™ (B) before and after 4 weeks incubation at 97% RH/40°C, Remicade® (C) and Remsima™ (D). Fragment, monomer, dimer and trimer species annotated in ion mobility spectra.
