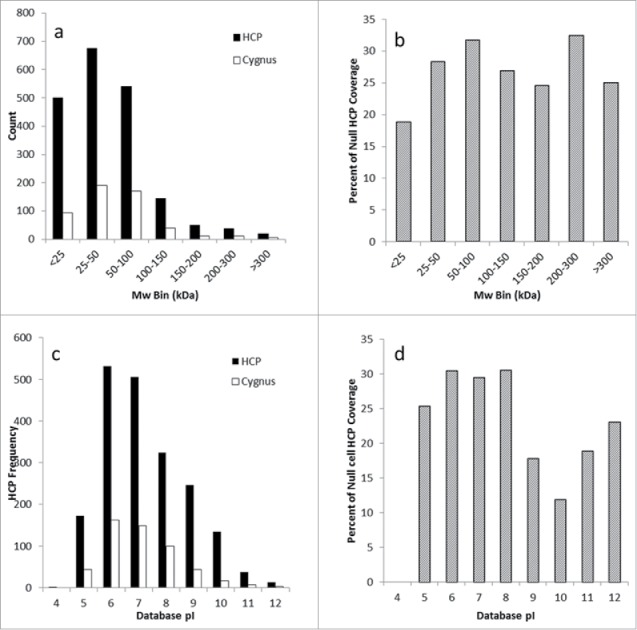
Figure 5.

Evaluation of anti-HCP coverage across the molecular weight and pI distribution by protein number and percent coverage. Fig. 5a compares the number of HCPs in each molecular weight bin compared with the number recognized by the Cygnus reagent, and Fig. 5b shows the percent coverage as a function of molecular weight. Fig. 5C compares the number of HCPs identified in each pI bin compared with the number recognized by the Cygnus reagent, while Fig. 5D shows the percent coverage as a function of pI.
