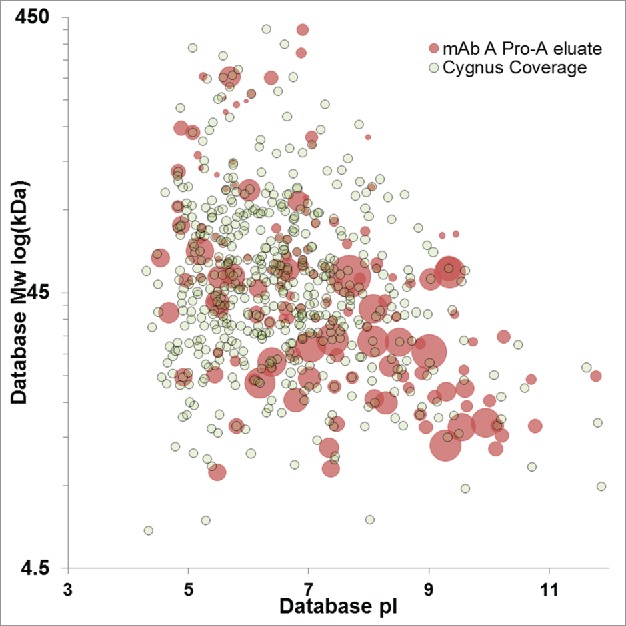
Figure 6.

Virtual 2D-DIGE comparison of downstream impurities identified in the Protein A eluate of mAb A (red) and HCPs with ELISA coverage identified uniquely by anti-HCP affinity purification (gray). Protein A impurities with a concentric gray dot have confirmed ELISA immunoreactivity. Protein A impurity spot size is scaled relative to protein abundance, while fixed spot size is used for HCPs identified by anti-HCP affinity purification.
