
Figure 2.
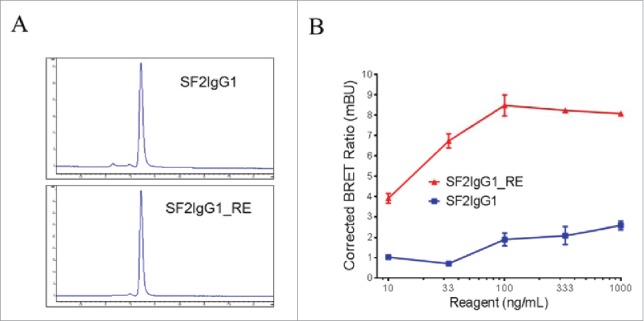
Assessment of monodispersity and multimerization of SF2IgG1 and SF2IgG1_RE. (A) SEC profiles of SF2IgG1 and SF2IgG1_RE antibodies in solution. The y axes are absorbance values at 280 nm. The x axes are retention times in minutes. (B) NanoBRET PPI assay for SF2IgG1 and SF2IgG1_RE. Increasing concentrations (from 10 ng/mL to 1000 ng/mL) of both Nanoluc donor antibody and Halotag receptor antibody were applied to HEK-Blue: OX40 cells and NanoBRET PPI assays were conducted. Mean Corrected BRET ratio were plotted against the concentrations of test antibodies (Data expressed as mean ± SEM, n 2).