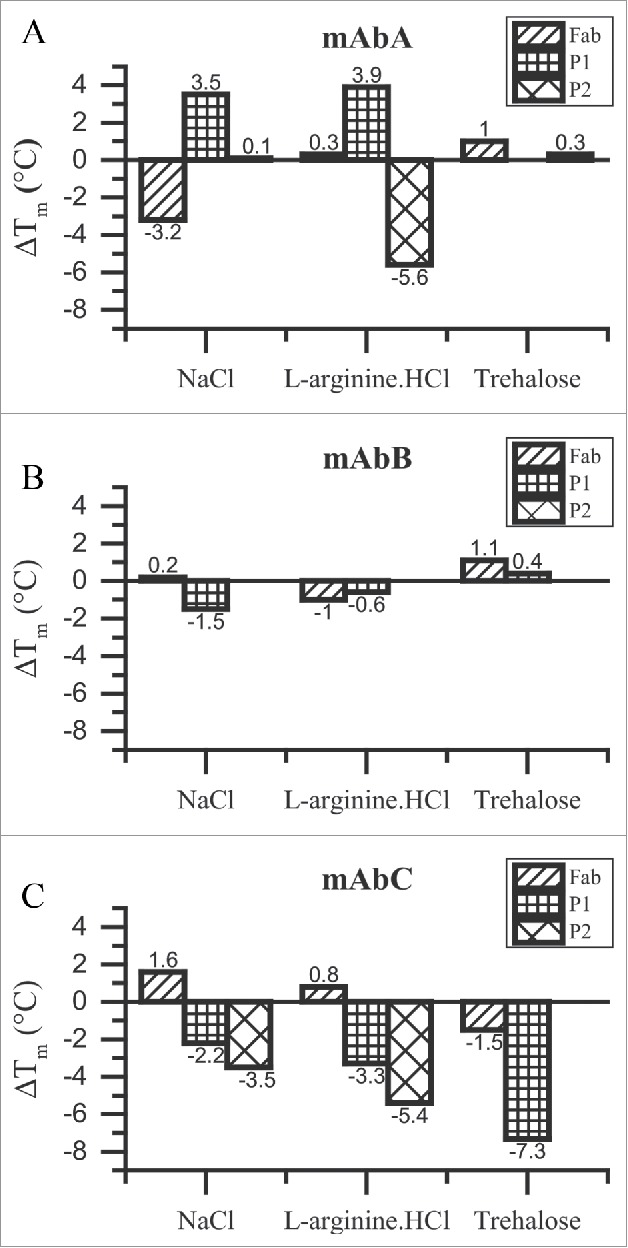
Figure 3.

ΔTm analysis for the Fab, P1 and P2 transitions of mAbA (A), mAbB (B) and mAbC (C). Shift in Tm values with respect to 25 mM Na-acetate buffer alone, ΔTm, are plotted. Positive ΔTm values indicate an increase in the Tm value compared to that in the presence of buffer alone and vice versa. NaCl and L-arginine.HCl were used at a final concentration of 100 mM, whereas trehalose was used at a final concentration of 200 mM.
