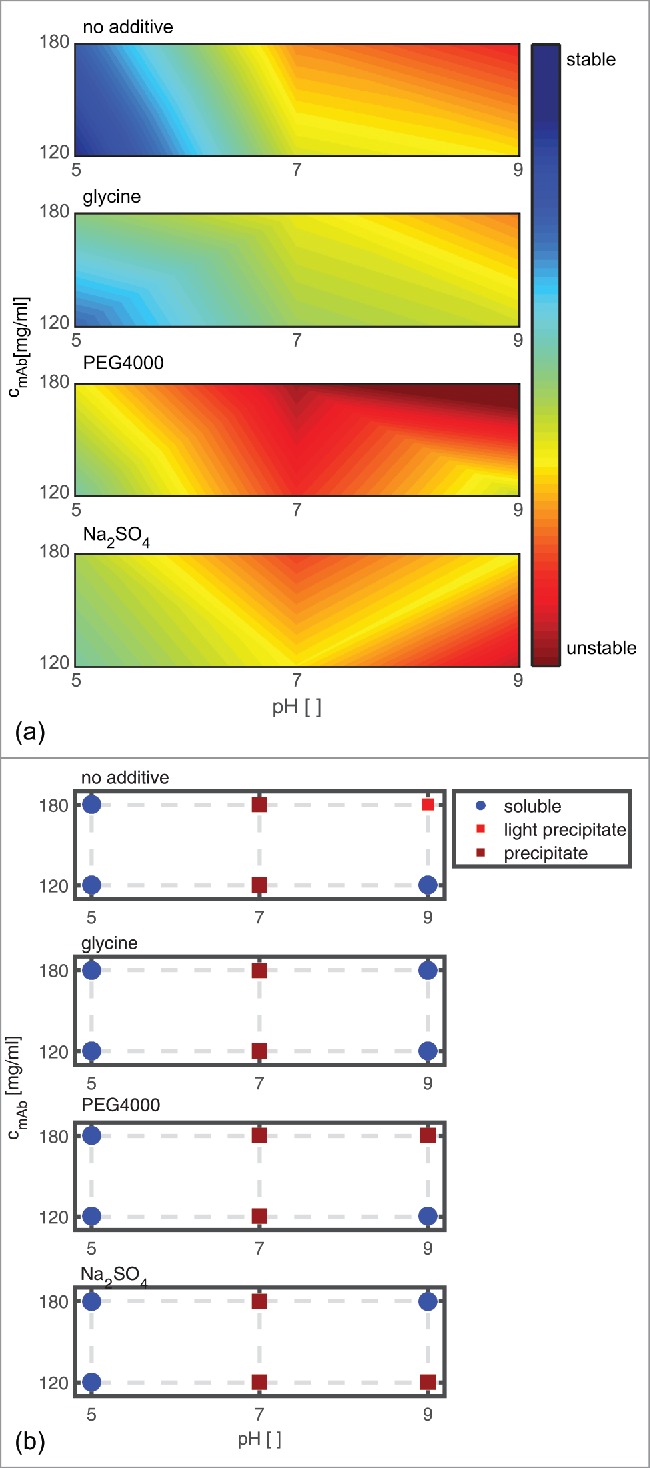
Figure 8.

Scoring of analytical results is shown in relation to the long-term colloidal stability (a). The subplots from top to bottom show the predicted impact at pH 5, pH 7, and pH 9 with mAb concentrations of 120 and 180 mg/ml without additive in solution, with the addition of 150 mM glycine, 1.2 (m/V)% PEG4000, and 160 mM Na2SO4, respectively. The scoring of the phase behavior at t40 of similar samples is depicted on the right hand side for easier comparison (b).
