
Figure 4.
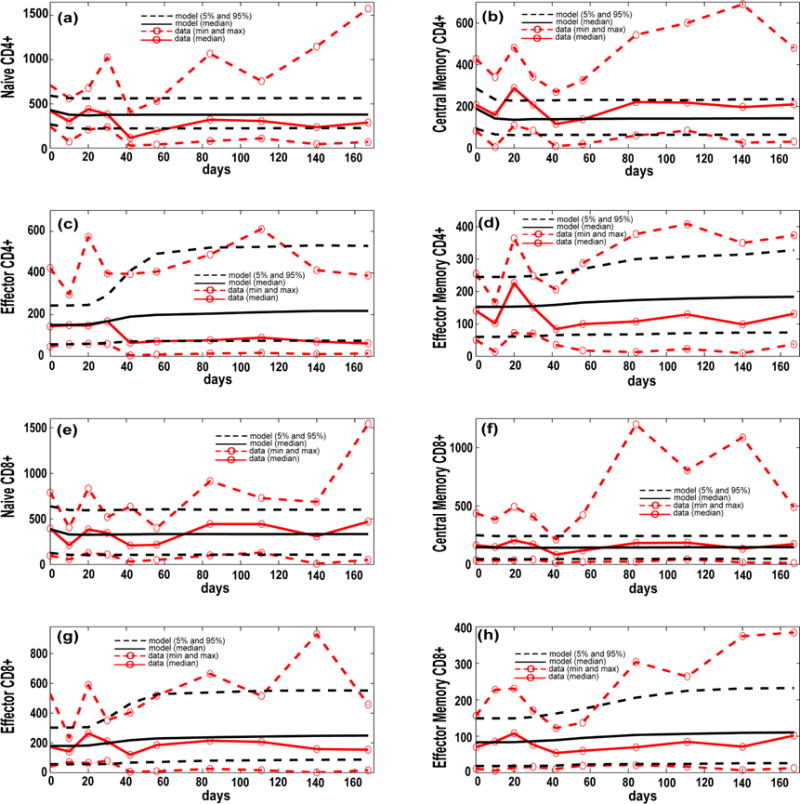
Computational model calibration (blood compartment). NHP experimental data on blood T cell phenotypes (see Supplementary File 3) are plotted here versus the in silico datasets of blood T cell phenotypes (blood compartment), from our computer simulations of 3000 granulomas coupled to the blood and LN dynamics. The x-axis shows a time span of infection up to 200 days to match the NHP blood data. The y-axis represents cells/cm3. (a–h) In silico dataset of 3000 time courses of 8 T cell classes generated in the blood compartment (black solid line [mean] and black dashed lines [5th and 95th percentiles]) compared to experimental data on T cell phenotypes in the blood of Mtb-infected NHPs (red dashed lines with red open circles, representing the min and max). For the minimum and maximum of the NHP data we chose the lowest and highest values at any time point across all the NHPs. In silico predictions are displayed as median (black solid line) and minimum and maximum (dashed black lines). We show Naïve CD4+ T cells (a) and CD8+ T cells (e); Central Memory CD4+ T cells (b) and CD8+ T cells (f); Effector CD4+ T cells (c) CD8+ T cells (g) and Memory CD4+ T cells (d) and CD8+ T cells (h). The in silico data have been obtained by summing the respective Mtb-specific and non Mtb-specific equations of the blood compartment of the computational model [36].