
Figure 7.
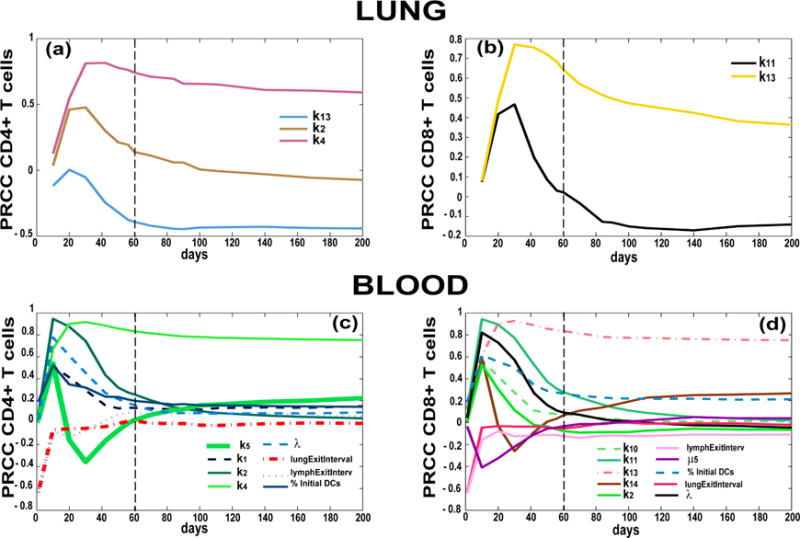
Partial Ranked Correlation Coefficient (PRCC) time courses of mechanisms/parameters affecting adaptive immune response in the lung and blood compartments. Each plot has days post infection (up to 200 days) on the x-axis and PRCC values on the y-axis (between −1 and 1). The PRCCs plotted are the only ones that resulted significant (i.e., p <10−3) and with an absolute value greater than 0.3. Outcomes shown are Mtb-specific Effector T cells in the lung ((a) CD4+ T cells and (b) CD8+ T cells) and in the blood ((c) CD4+ T cells and (d) CD8+ T cell). Parameter definitions: k2—Naïve CD4+ T cell priming, k4—CD4+ T cell precursor proliferation, k13—CD8+ T cell precursor proliferation, k14—CD8+ T cell differentiation to effector, k11—Naïve CD8+ T cell priming, λ: Frequency of Mtb-specific Naïve T cells in the blood/LN, μ5: half-life of Mature DCs in the LN (see Appendix A for details on the parameters.)