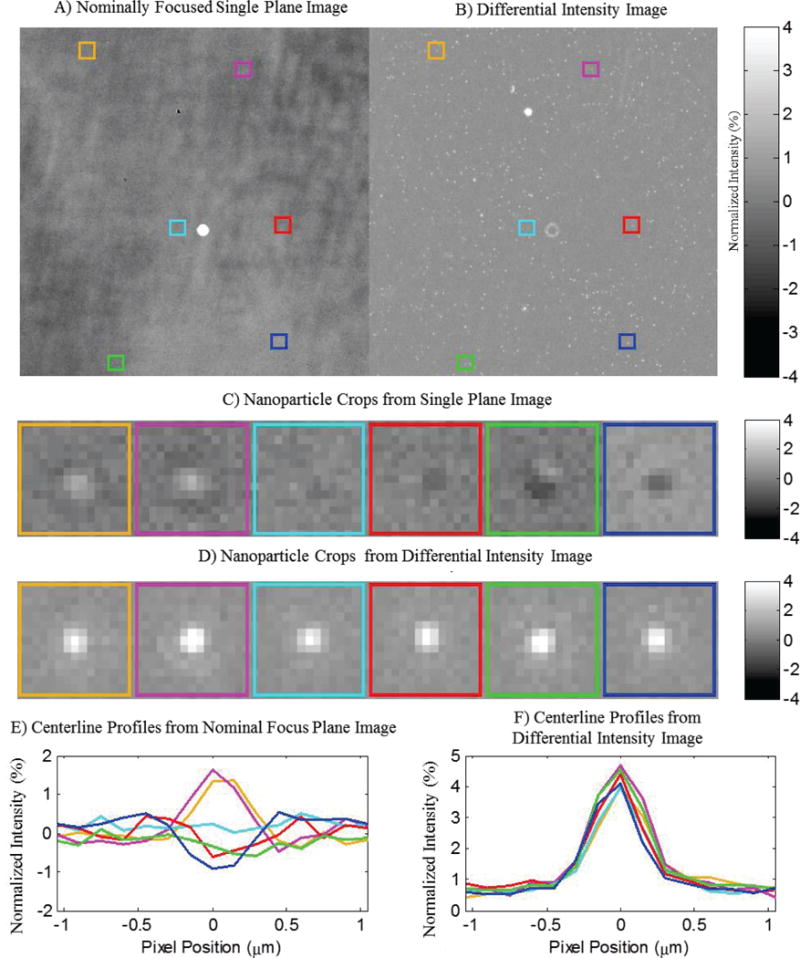
Figure 7.

A) 100 nm Polystyrene nanospheres exhibit varying signal levels in a single plane image stemming from morphological variations on the substrate surface. The variations among the nanoparticle signals diminish in the differential normalized intensity image, enabling their identification by template matching. Colored Boxes identify the locations of representative nanoparticles taken from different regions of the field of view. B) Differential intensity image generated from the total peak to peak change in intensity over a 6 μm Z-stack sampled at 200nm increments. C) Crops of the observed appearance of representative nanoparticles from the colored regions in A. D) Differential intensity crops of identical regions from B. E) Centerline profiles of the regions shown in C, displaying varying appearance due to slight sample misalignment. F) Centerline profiles of regions in D, demonstrating consistent signal via differential intensity measurements.
