
Fig. 6.
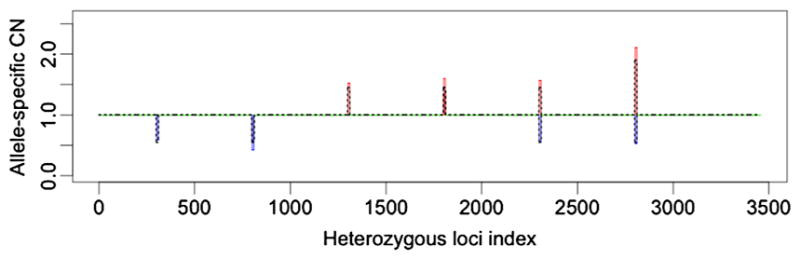
The allele-specific copy number estimates from Falcon-X under 45% tumor purity with signals spanning 10 inherited heterozygous sites. The two colored lines represent the estimates of the two allele-specific copy numbers (Ca and Cb), and the two lines overlap when the two estimates are the same. Losses are shown in blue and gains are shown in red. Normal copy number is shown in green. Dotted black lines show the true allele-specific copy numbers in the spike-in set.