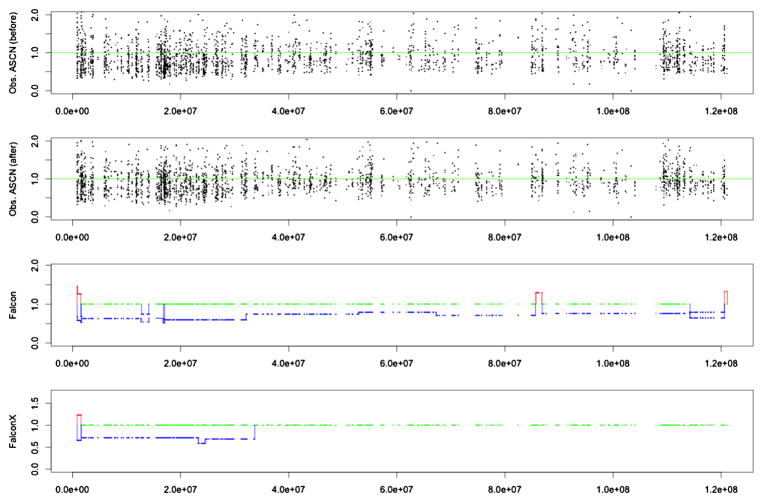
Fig. 7.
Data from chromosome 1 p arm of a breast cancer patient (patient ID: Brca1Br10): The top plot shows the tumor to normal ratios of allele-specific coverage, that is, and . The second plot shows the same ratios after adjusting by total coverage bias. In the first and second plots, a horizontal green line is plotted at value 1.0 for reference. The third and bottom plots show the allele-specific copy number estimates by Falcon and Falcon-X, respectively. Losses are shown in blue and gains are shown in red. Normal copy number is shown in green.

