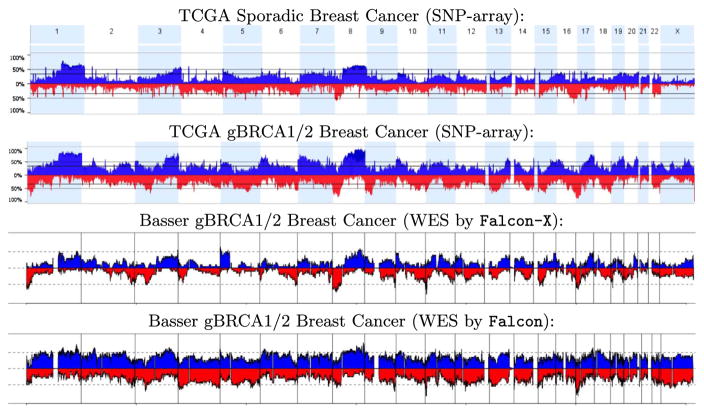
Fig. 9.
Frequency of detected occurrence of gains (in blue, above the axis) and losses (in red, below the axis) of total copy number in three breast cancer cohorts: TCGA sporadic breast cancers, TCGA gBRCA1/2 breast cancers, and our Basser gBRCA1/2 breast cancers. The TCGA cohorts, shown in the top two plots, were profiled by the genotyping array. The Basser samples were profiled by WES and analyzed by Falcon-X, shown in the third plot from the top, and by Falcon, shown in the bottom plot. The horizontal axis shows genome location, and is aligned between the four plots. The vertical axis shows the proportion of samples where a call is made. Chromosome boundaries are marked by vertical lines or color shading.

