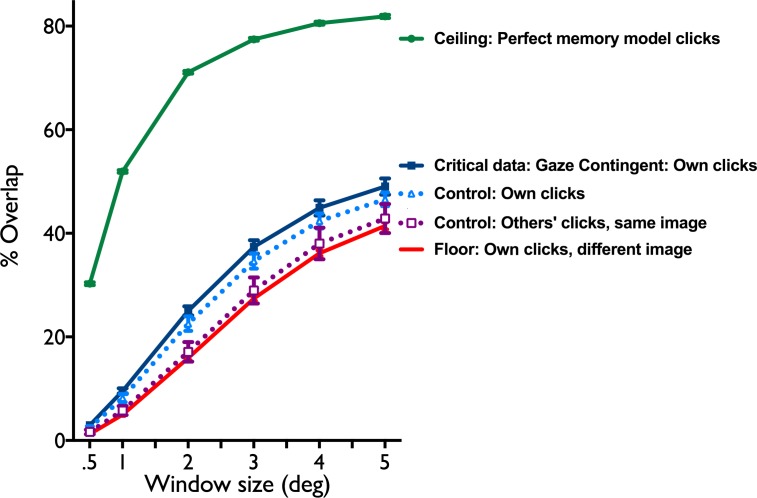
Figure 2.
Data represent the percentage overlap between “windows” of different size radius (in degrees of visual angle) around each fixation and clicks on where observers thought they looked in the image for the spotlight (gaze-contingent) condition (dark blue) and the control condition (light blue, dotted). An observer's fixations overlapped with where a different observer thought someone else might look at in the same image is shown in purple dotted. The perfect memory model represents ceiling performance (green), while the overlap with another image represents chance performance (red). Error bars represent SE.

