Figure 7.
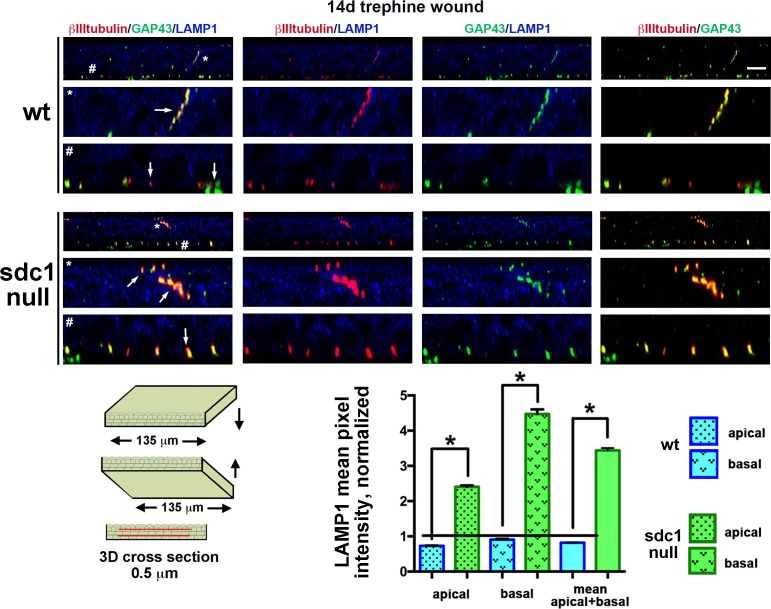
LAMP1 increases in SDC-null corneas 14 days after trephine wound. Representative 3D images rotated to generate cross-sectional views show the localization of GAP43 (green), βIII tubulin (red), and LAMP1 (blue) in WT (top) and SDC1-null (bottom) corneas. These images show staining within a 0.5-μm cross-sections. Data indicate that axon fragments are being degraded (arrows). Representative INTs (*) and SBNs (#) have been highlighted and enlarged 3-fold. When LAMP1 expression within apical and basal cell layers 14 days after trephine injury is quantified and compared with unwounded controls (Fig. 2B), LAMP1 increases over 3-fold in SDC1-null corneas but remains the same in WT corneas. Scale bar: 10 μm.

