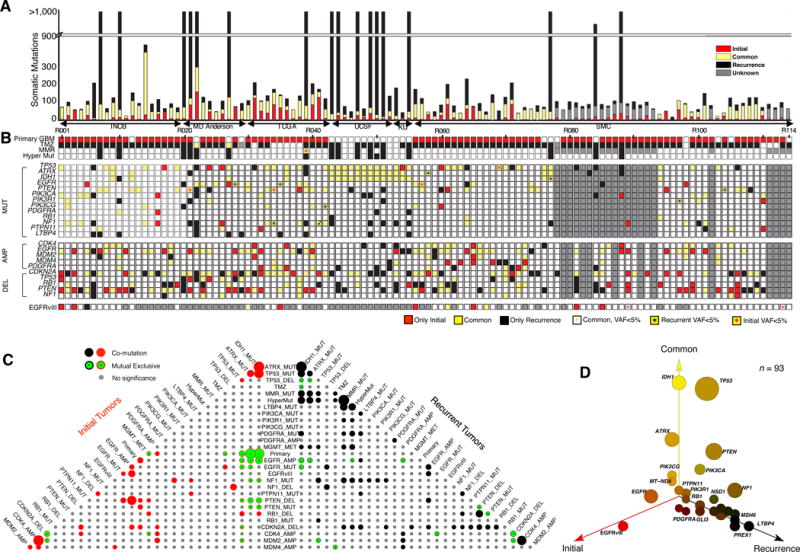
Figure 1. Mutation landscape of recurrent Glioblastoma.

(A) Number of somatic mutations. 114 Patients from six sources (Instituto Neurologico C. Besta, MD Anderson Cancer Center, The Cancer Genome Atlas, University of California San Francisco, Kyoto University, and Samsung Medical Center). (B) Clinic and genetic profile of patients. TMZ indicates Temozolomide; MMR represents mismatch repair pathway (MSH6, MSH2, MSH4, MSH5, PMS1, PMS2, MLH1, MLH3 were considered). Hyper Mut represents hypermutation. MUT indicates somatic non-synonymous mutations with allele frequency >5% in at least one sample. AMP/DEL indicates copy number change with segmentation mean >0.5, computed either by SNP/CGH array data or by whole-exome sequencing data. TMZ represents Temozolomide. (C) Pyramids plot highlighting the correlation between different features. Hypergeometric test was performed for each pair of elements by considering Initial and recurrent tumors separately. The size of the circle indicates significance level of the correlation. Any associations with p-value < 0.1 were illustrated in this plot. (D) 3-D bubble plot illustrating the mutation frequency of somatic non-synonymous mutations in exclusively initial (red, left axis), exclusively recurrence (black, right axis), and in common (yellow, upper axis). 93 patients with exome-sequencing data in matched normal, initial tumor, and recurrent tumor were considered in this analysis.
