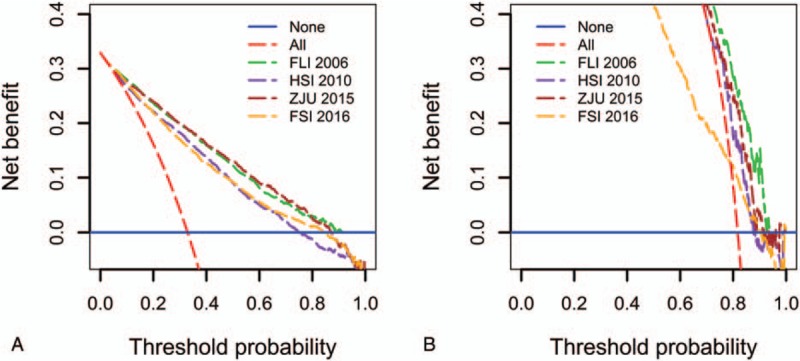
Figure 3.

Decision curve analysis of the 4 prediction models for fatty liver disease (FLD) in the overall population (A) and the obese subpopulation (B). The solid blue line corresponds to the net benefit when no participant has FLD, while the red dashed line corresponds to the net benefit when all participants have FLD. The preferred model is the model with the highest net benefit at any given threshold. FLI 2006 = the Fatty Liver Index, FSI 2016 = the Framingham Steatosis Index, HSI 2010 = the Hepatic Steatosis Index, ZJU 2015 = the ZJU index.
