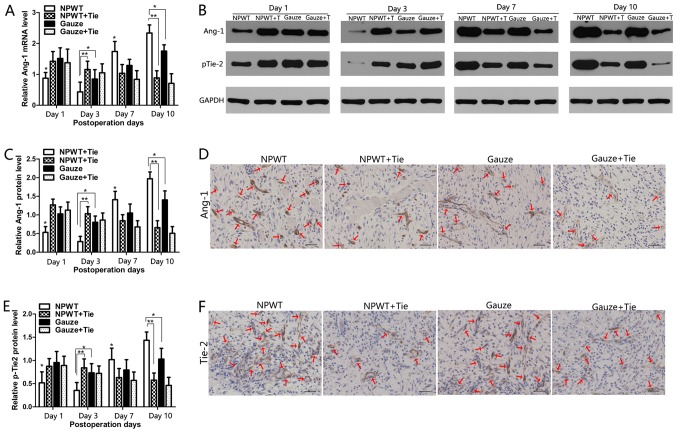
Figure 5.
Changes in the expression of angiogenin-1 (Ang-1) and the phosphorylation of tyrosine kinase receptor-2 (p-Tie-2). (A) Gene expression levels of Ang-1 were assessed by RT-qPCR. (B) Representative western blots showing the protein expression of Ang-1 in the different groups. Representative western blots showing Tie2 tyrosine phosphorylation levels in the different groups. (C) Statistical analysis of Ang-1 protein expression levels. (D) Immunohistochemical staining of Ang-1 protein on day 7 after the surgery. The Ang-1 protein signals were mainly present in pericyte-like perivascular mural cells (red arrows). (E) Quantify analysis the expression of p-Tie-2 in the different groups. (F) Immunohistochemical staining of Tie-2 in the different groups on day 7. Tie-2 protein signals were mainly present in endothelial cells (red arrows). Scale bar, 50 µm. All data are expressed as the means ± SD (*P<0.05 and **P<0.01).

