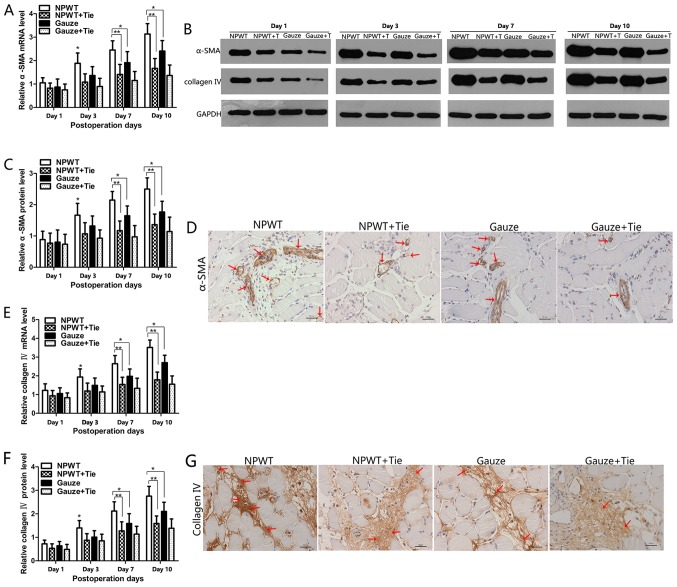
Figure 6.
Changes in the expression levels of α-smooth muscle actin (α-SMA) and collagen type IV. (A) The expression levels of α-SMA mRNA in the different groups. (B) Representative western blots showing the protein expression of α-SMA. Representative western blots showing the protein expression of collagen type IV. (C) Quantitative analysis of the protein expression levels of α-SMA. The protein expression of α-SMA was consistent with its mRNA expression profile. (D) Immunohistochemical staining of α-SMA showing that the α-SMA protein was mainly present in pericytes (red arrows). (E) Expression levels of collagen type IV gene in the different groups and time points. (F) Quantitative analysis of the protein expression of collagen type IV. (G) Immunohistochemical staining of collagen type IV showing that the positive collagen type IV on day 7, and the positive collagen type IV was higher in the negative pressure wound therapy (NPWT) group than in the other groups (red arrows). Scale bar, 50 µm. All data are expressed as the means ± SD (*P<0.05 and **P<0.01).

