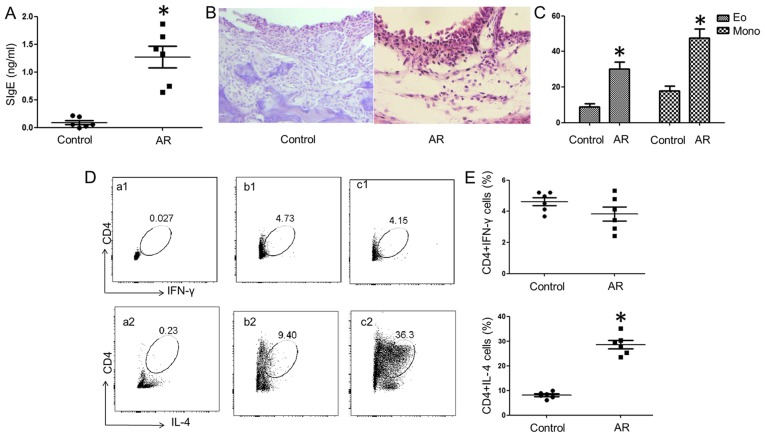
Figure 1.
Induction of a mouse model with allergic inflammation. Samples were collected from mice with AR and control mice. (A) The dot plots indicate the levels of OVA-specific IgE (SIgE) in the serum. (B) Histopathological images of the nasal mucosa. Hematoxylin and eosin staining; magnification, ×200. (C) The bars indicate the counts of eosinophils (Eo) and mononuclear (Mono) cells in the nasal mucosa. (D) The scatter plots indicate the frequency of CD4+ IL-4+ T cells and CD4+ IFN-γ+ T cells in splenic Mono cells. (a1 and a2) Isotype control; (b1 and b2) control; (c1 and c2) AR. (E) The dot plots represent the summarized frequencies of (D). The data are presented as mean ± standard deviation. *P<0.05 vs. the control group. AR, allergic rhinitis; OVA, ovalbumin; IL, interleukin; IFN, interferon.

