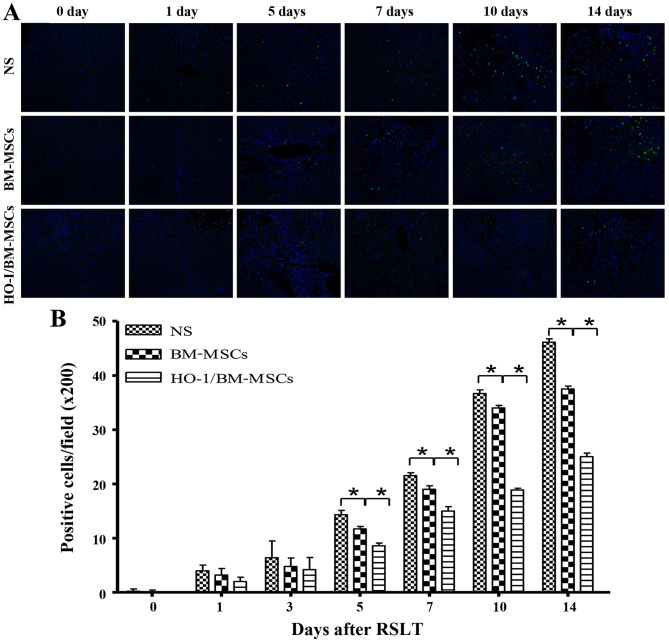
Figure 3.
Apoptosis in the transplanted liver tissues (magnification, ×200). (A and B) Terminal deoxynucleotidyl transferase dUTP nick end labeling staining positive cells appear green and represent apoptotic cells, and DAPI-labeled nuclei appear blue. Apoptotic cells were scattered in the transplanted liver on POD 0 and POD 1, with no significant differences between the three groups. The numbers of apoptotic cells in the HO-1/BM-MSCs-treated group were significantly lower than those in the normal saline (NS)-treated group on POD 5, POD 7, POD 10 and POD 14. *P<0.05 as indicated. POD, post-operative day; HO-1/BM-MSCs, HO-1 transduced BM-MSCs.

