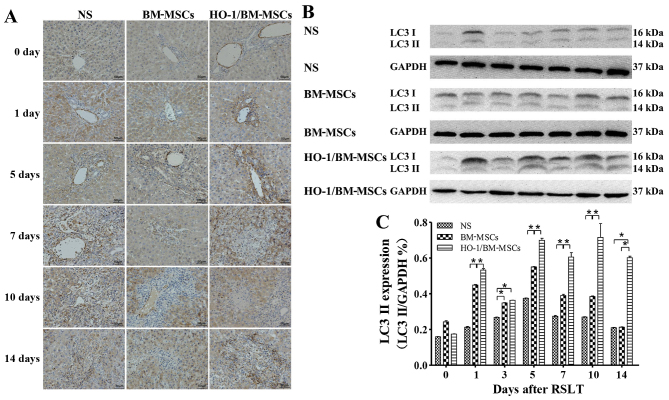
Figure 5.
Expression of autophagy-related protein LC3 I/II following RSLT. (A) Expression of LC3 I/II protein immunohistochemically on POD 0, POD 1, POD 5, POD 7, POD 10 and POD 14. Only a small amount of LC3 I/II protein was present in endothelia of the central vein on POD 0, which was similar in all three groups. The LC3 I/II protein was also visible in cytoplasm of hepatocytes on POD 1. The protein abundance increased significantly after POD 5, appearing in the cytoplasm of most central venous endothelia and hepatocytes. The overall expression in the HO-1/BM-MSCs-treated group was the highest and was much higher than that in the normal saline (NS)-treated group and in the BM-MSCs-treated group. (B and C) Expression of the LC3 II protein as demonstrated by western blotting on POD 0, POD 1, POD 3, POD 5, POD 7, POD 10 and POD 14. The protein level in the HO-1/BM-MSCs-treated group was significantly higher than that of the NS-treated group and BM-MSCs-treated group at each time-point, except on POD 0 and POD 3. *P<0.05 as indicated. RSLT, reduced-size liver transplantation; POD, post-operative day; HO-1/BM-MSCs, HO-1 transduced BM-MSCs; BM-MSCs, bone marrow mesenchymal stem cells.

